|
Download Data (XLS File) |
|
||||||||
|
||||||||
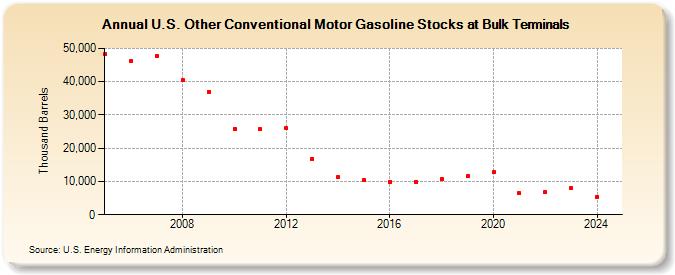
| U.S. Other Conventional Motor Gasoline Stocks at Bulk Terminals (Thousand Barrels) | ||||||||
| Decade | Year-0 | Year-1 | Year-2 | Year-3 | Year-4 | Year-5 | Year-6 | Year-7 | Year-8 | Year-9 |
|---|---|---|---|---|---|---|---|---|---|---|
| 2000's | 48,199 | 46,068 | 47,752 | 40,357 | 37,033 | |||||
| 2010's | 25,809 | 25,630 | 25,967 | 16,753 | 11,235 | 10,406 | 9,897 | 9,939 | 10,660 | 11,540 |
| 2020's | 12,697 | 6,396 | 6,821 | 7,792 |
| - = No Data Reported; -- = Not Applicable; NA = Not Available; W = Withheld to avoid disclosure of individual company data. |
| Release Date: 3/29/2024 |
| Next Release Date: 8/30/2024 |