|
Download Data (XLS File) |
|
||||||||
|
||||||||
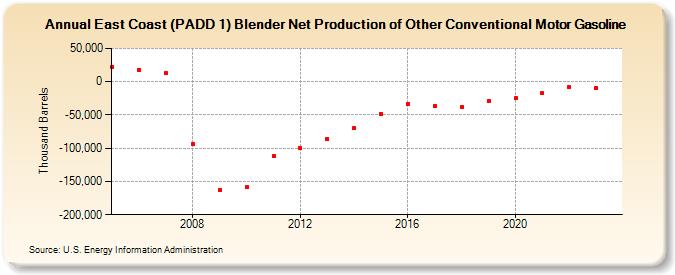
| East Coast (PADD 1) Blender Net Production of Other Conventional Motor Gasoline (Thousand Barrels) | ||||||||
| Decade | Year-0 | Year-1 | Year-2 | Year-3 | Year-4 | Year-5 | Year-6 | Year-7 | Year-8 | Year-9 |
|---|---|---|---|---|---|---|---|---|---|---|
| 2000's | 22,744 | 17,705 | 12,738 | -93,019 | -162,410 | |||||
| 2010's | -158,192 | -111,995 | -100,415 | -85,995 | -69,967 | -48,412 | -33,115 | -36,831 | -37,623 | -29,288 |
| 2020's | -24,631 | -17,700 | -8,548 | -9,289 |
| - = No Data Reported; -- = Not Applicable; NA = Not Available; W = Withheld to avoid disclosure of individual company data. |
| Release Date: 8/30/2024 |
| Next Release Date: 8/29/2025 |