|
Download Data (XLS File) |
|
||||||||
|
||||||||
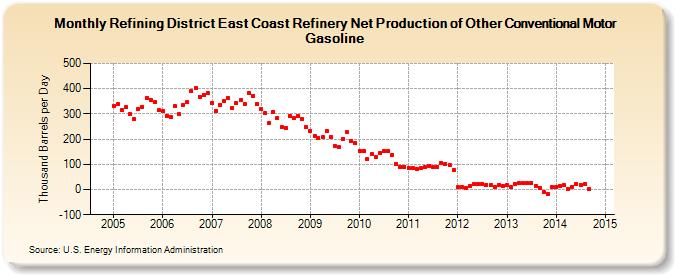
| Refining District East Coast Refinery Net Production of Other Conventional Motor Gasoline (Thousand Barrels per Day) | ||||||||
| Year | Jan | Feb | Mar | Apr | May | Jun | Jul | Aug | Sep | Oct | Nov | Dec |
|---|---|---|---|---|---|---|---|---|---|---|---|---|
| 2005 | 331 | 339 | 316 | 327 | 300 | 278 | 318 | 329 | 364 | 357 | 346 | 314 |
| 2006 | 312 | 292 | 287 | 330 | 298 | 336 | 347 | 390 | 402 | 369 | 376 | 381 |
| 2007 | 344 | 312 | 337 | 350 | 363 | 323 | 343 | 354 | 339 | 383 | 372 | 339 |
| 2008 | 318 | 304 | 264 | 308 | 284 | 247 | 244 | 292 | 283 | 293 | 279 | 247 |
| 2009 | 234 | 214 | 205 | 208 | 232 | 210 | 172 | 167 | 201 | 227 | 194 | 184 |
| 2010 | 153 | 152 | 122 | 140 | 127 | 145 | 153 | 152 | 137 | 101 | 91 | 91 |
| 2011 | 86 | 86 | 82 | 84 | 89 | 95 | 90 | 90 | 107 | 101 | 98 | 78 |
| 2012 | 8 | 9 | 7 | 15 | 21 | 21 | 22 | 19 | 17 | 11 | 18 | 14 |
| 2013 | 18 | 8 | 23 | 24 | 25 | 25 | 27 | 15 | 7 | -11 | -18 | 9 |
| 2014 | 10 | 12 | 18 | 2 | 11 | 23 | 19 | 22 | 3 | |||
| - = No Data Reported; -- = Not Applicable; NA = Not Available; W = Withheld to avoid disclosure of individual company data. |
| Release Date: 8/30/2024 |
| Next Release Date: 9/30/2024 |