|
Download Data (XLS File) |
|
||||||||
|
||||||||
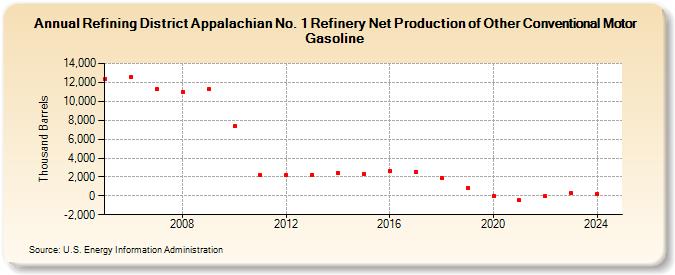
| Refining District Appalachian No. 1 Refinery Net Production of Other Conventional Motor Gasoline (Thousand Barrels) | ||||||||
| Decade | Year-0 | Year-1 | Year-2 | Year-3 | Year-4 | Year-5 | Year-6 | Year-7 | Year-8 | Year-9 |
|---|---|---|---|---|---|---|---|---|---|---|
| 2000's | 12,372 | 12,554 | 11,261 | 11,008 | 11,248 | |||||
| 2010's | 7,340 | 2,167 | 2,213 | 2,223 | 2,419 | 2,319 | 2,647 | 2,541 | 1,916 | 830 |
| 2020's | -21 | -493 | -59 | 258 |
| - = No Data Reported; -- = Not Applicable; NA = Not Available; W = Withheld to avoid disclosure of individual company data. |
| Release Date: 3/29/2024 |
| Next Release Date: 8/30/2024 |