|
Download Data (XLS File) |
|
||||||||
|
||||||||
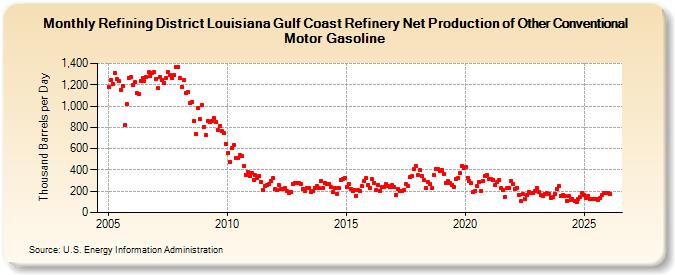
| Refining District Louisiana Gulf Coast Refinery Net Production of Other Conventional Motor Gasoline (Thousand Barrels per Day) | ||||||||
| Year | Jan | Feb | Mar | Apr | May | Jun | Jul | Aug | Sep | Oct | Nov | Dec |
|---|---|---|---|---|---|---|---|---|---|---|---|---|
| 2005 | 1,180 | 1,245 | 1,212 | 1,315 | 1,256 | 1,235 | 1,151 | 1,189 | 819 | 1,016 | 1,267 | 1,271 |
| 2006 | 1,200 | 1,223 | 1,121 | 1,115 | 1,239 | 1,259 | 1,237 | 1,270 | 1,316 | 1,280 | 1,313 | 1,317 |
| 2007 | 1,257 | 1,168 | 1,273 | 1,245 | 1,220 | 1,268 | 1,322 | 1,295 | 1,267 | 1,288 | 1,367 | 1,368 |
| 2008 | 1,259 | 1,178 | 1,244 | 1,124 | 1,128 | 1,030 | 1,036 | 864 | 740 | 978 | 878 | 1,014 |
| 2009 | 808 | 724 | 858 | 852 | 858 | 884 | 852 | 780 | 817 | 762 | 743 | 647 |
| 2010 | 555 | 479 | 609 | 634 | 516 | 511 | 540 | 529 | 441 | 354 | 384 | 347 |
| 2011 | 373 | 304 | 350 | 323 | 345 | 285 | 214 | 248 | 261 | 270 | 300 | 321 |
| 2012 | 225 | 209 | 255 | 217 | 224 | 235 | 200 | 186 | 189 | 272 | 274 | 273 |
| 2013 | 274 | 268 | 224 | 203 | 230 | 233 | 197 | 204 | 234 | 253 | 228 | 299 |
| 2014 | 228 | 282 | 271 | 271 | 241 | 191 | 228 | 176 | 233 | 305 | 314 | 328 |
| 2015 | 238 | 270 | 225 | 200 | 214 | 154 | 208 | 202 | 245 | 301 | 324 | 258 |
| 2016 | 232 | 312 | 280 | 213 | 263 | 206 | 238 | 238 | 264 | 249 | 238 | 261 |
| 2017 | 240 | 165 | 222 | 202 | 201 | 215 | 264 | 254 | 331 | 339 | 413 | 435 |
| 2018 | 354 | 396 | 344 | 309 | 235 | 283 | 266 | 235 | 349 | 413 | 412 | 391 |
| 2019 | 398 | 359 | 282 | 292 | 278 | 260 | 237 | 319 | 320 | 368 | 437 | 414 |
| 2020 | 426 | 329 | 297 | 273 | 189 | 206 | 246 | 291 | 203 | 298 | 341 | 356 |
| 2021 | 319 | 317 | 306 | 260 | 283 | 308 | 227 | 209 | 147 | 226 | 232 | 299 |
| 2022 | 269 | 218 | 235 | 165 | 105 | 173 | 130 | 167 | 195 | 182 | 187 | 202 |
| 2023 | 226 | 189 | 164 | 160 | 176 | 179 | 175 | 140 | 146 | 177 | 220 | 248 |
| 2024 | 172 | |||||||||||
| - = No Data Reported; -- = Not Applicable; NA = Not Available; W = Withheld to avoid disclosure of individual company data. |
| Release Date: 3/29/2024 |
| Next Release Date: 4/30/2024 |