|
Download Data (XLS File) |
|
||||||||
|
||||||||
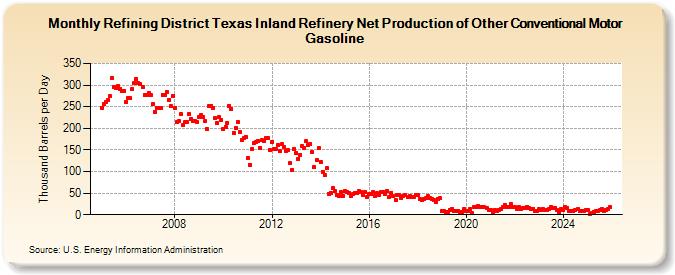
| Refining District Texas Inland Refinery Net Production of Other Conventional Motor Gasoline (Thousand Barrels per Day) | ||||||||
| Year | Jan | Feb | Mar | Apr | May | Jun | Jul | Aug | Sep | Oct | Nov | Dec |
|---|---|---|---|---|---|---|---|---|---|---|---|---|
| 2005 | 248 | 256 | 262 | 266 | 274 | 317 | 295 | 293 | 298 | 292 | 287 | 287 |
| 2006 | 261 | 271 | 269 | 291 | 305 | 314 | 305 | 302 | 296 | 277 | 278 | 282 |
| 2007 | 276 | 256 | 238 | 248 | 246 | 248 | 278 | 276 | 284 | 266 | 252 | 275 |
| 2008 | 248 | 214 | 217 | 233 | 208 | 214 | 214 | 233 | 221 | 218 | 216 | 215 |
| 2009 | 227 | 230 | 225 | 216 | 198 | 251 | 252 | 247 | 223 | 212 | 225 | 219 |
| 2010 | 199 | 203 | 213 | 252 | 245 | 190 | 201 | 215 | 191 | 174 | 178 | 181 |
| 2011 | 132 | 116 | 152 | 165 | 168 | 171 | 155 | 172 | 171 | 177 | 178 | 150 |
| 2012 | 169 | 151 | 152 | 161 | 148 | 163 | 156 | 148 | 149 | 119 | 103 | 152 |
| 2013 | 142 | 130 | 138 | 159 | 155 | 170 | 162 | 164 | 145 | 110 | 126 | 154 |
| 2014 | 122 | 100 | 92 | 107 | 48 | 51 | 61 | 55 | 45 | 44 | 52 | 44 |
| 2015 | 55 | 53 | 50 | 44 | 47 | 50 | 50 | 54 | 53 | 45 | 52 | 40 |
| 2016 | 49 | 47 | 52 | 43 | 50 | 45 | 53 | 52 | 48 | 55 | 42 | 51 |
| 2017 | 43 | 35 | 45 | 46 | 39 | 44 | 45 | 41 | 43 | 40 | 40 | 46 |
| 2018 | 45 | 37 | 35 | 36 | 38 | 43 | 39 | 37 | 34 | 30 | 37 | 38 |
| 2019 | 9 | 8 | 7 | 7 | 11 | 14 | 9 | 8 | 9 | 6 | 7 | 13 |
| 2020 | 9 | 9 | 14 | 3 | 17 | 18 | 21 | 18 | 19 | 17 | 16 | 11 |
| 2021 | 11 | 4 | 11 | 9 | 12 | 13 | 19 | 23 | 19 | 17 | 25 | 19 |
| 2022 | 18 | 14 | 17 | 13 | 16 | 15 | 19 | 16 | 13 | 14 | 8 | 8 |
| 2023 | 13 | 10 | 13 | 10 | 12 | 13 | 18 | 15 | 16 | 10 | 6 | 13 |
| 2024 | 12 | |||||||||||
| - = No Data Reported; -- = Not Applicable; NA = Not Available; W = Withheld to avoid disclosure of individual company data. |
| Release Date: 3/29/2024 |
| Next Release Date: 4/30/2024 |