|
Download Data (XLS File) |
|
||||||||
|
||||||||
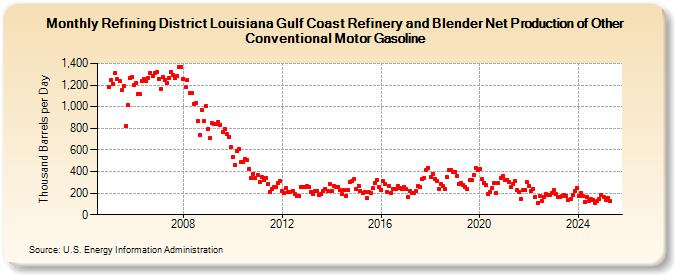
| Refining District Louisiana Gulf Coast Refinery and Blender Net Production of Other Conventional Motor Gasoline (Thousand Barrels per Day) | ||||||||
| Year | Jan | Feb | Mar | Apr | May | Jun | Jul | Aug | Sep | Oct | Nov | Dec |
|---|---|---|---|---|---|---|---|---|---|---|---|---|
| 2005 | 1,180 | 1,245 | 1,212 | 1,315 | 1,256 | 1,235 | 1,151 | 1,189 | 819 | 1,016 | 1,267 | 1,271 |
| 2006 | 1,200 | 1,223 | 1,121 | 1,115 | 1,239 | 1,259 | 1,237 | 1,270 | 1,316 | 1,280 | 1,313 | 1,317 |
| 2007 | 1,257 | 1,168 | 1,273 | 1,245 | 1,220 | 1,268 | 1,322 | 1,295 | 1,267 | 1,288 | 1,367 | 1,368 |
| 2008 | 1,259 | 1,178 | 1,244 | 1,124 | 1,128 | 1,026 | 1,036 | 863 | 738 | 973 | 868 | 1,002 |
| 2009 | 795 | 711 | 847 | 837 | 839 | 862 | 832 | 766 | 795 | 743 | 724 | 628 |
| 2010 | 538 | 461 | 590 | 610 | 484 | 486 | 516 | 505 | 427 | 344 | 380 | 344 |
| 2011 | 370 | 301 | 347 | 320 | 341 | 282 | 214 | 241 | 252 | 261 | 291 | 311 |
| 2012 | 216 | 199 | 245 | 207 | 212 | 223 | 188 | 172 | 175 | 259 | 261 | 260 |
| 2013 | 263 | 256 | 210 | 189 | 217 | 221 | 183 | 190 | 221 | 241 | 217 | 288 |
| 2014 | 217 | 270 | 258 | 257 | 227 | 190 | 227 | 175 | 232 | 304 | 313 | 327 |
| 2015 | 237 | 269 | 223 | 199 | 213 | 153 | 208 | 201 | 243 | 297 | 322 | 258 |
| 2016 | 232 | 312 | 280 | 213 | 262 | 205 | 238 | 238 | 264 | 249 | 237 | 261 |
| 2017 | 240 | 165 | 222 | 202 | 201 | 215 | 264 | 254 | 327 | 340 | 413 | 435 |
| 2018 | 349 | 380 | 333 | 310 | 236 | 284 | 267 | 236 | 349 | 414 | 412 | 391 |
| 2019 | 399 | 360 | 283 | 293 | 279 | 261 | 238 | 319 | 320 | 368 | 437 | 414 |
| 2020 | 426 | 329 | 298 | 274 | 190 | 207 | 247 | 293 | 204 | 298 | 341 | 356 |
| 2021 | 319 | 317 | 307 | 260 | 283 | 308 | 228 | 210 | 148 | 227 | 233 | 299 |
| 2022 | 269 | 218 | 236 | 166 | 106 | 174 | 130 | 168 | 196 | 182 | 187 | 202 |
| 2023 | 226 | 189 | 165 | 161 | 177 | 180 | 176 | 140 | 146 | 178 | 220 | 248 |
| 2024 | 172 | |||||||||||
| - = No Data Reported; -- = Not Applicable; NA = Not Available; W = Withheld to avoid disclosure of individual company data. |
| Release Date: 3/29/2024 |
| Next Release Date: 4/30/2024 |