|
Download Data (XLS File) |
|
||||||||
|
||||||||
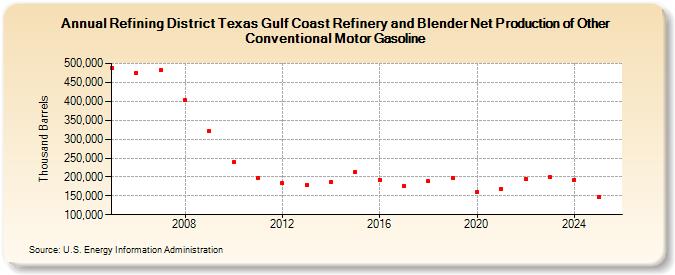
| Refining District Texas Gulf Coast Refinery and Blender Net Production of Other Conventional Motor Gasoline (Thousand Barrels) | ||||||||
| Decade | Year-0 | Year-1 | Year-2 | Year-3 | Year-4 | Year-5 | Year-6 | Year-7 | Year-8 | Year-9 |
|---|---|---|---|---|---|---|---|---|---|---|
| 2000's | 487,701 | 475,389 | 482,221 | 402,504 | 321,308 | |||||
| 2010's | 239,011 | 198,046 | 183,076 | 178,649 | 186,149 | 213,909 | 192,714 | 176,480 | 188,375 | 198,163 |
| 2020's | 160,763 | 168,854 | 194,566 | 198,830 |
| - = No Data Reported; -- = Not Applicable; NA = Not Available; W = Withheld to avoid disclosure of individual company data. |
| Release Date: 3/29/2024 |
| Next Release Date: 8/30/2024 |