|
Download Data (XLS File) |
|
||||||||
|
||||||||
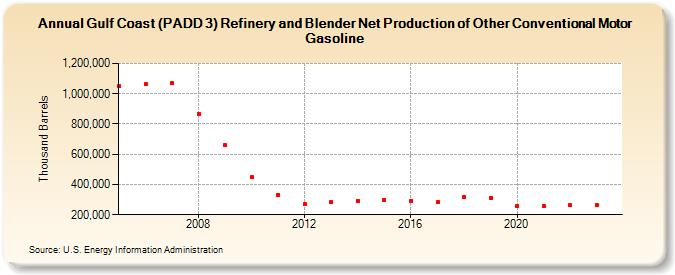
| Gulf Coast (PADD 3) Refinery and Blender Net Production of Other Conventional Motor Gasoline (Thousand Barrels) | ||||||||
| Decade | Year-0 | Year-1 | Year-2 | Year-3 | Year-4 | Year-5 | Year-6 | Year-7 | Year-8 | Year-9 |
|---|---|---|---|---|---|---|---|---|---|---|
| 2000's | 1,050,048 | 1,061,766 | 1,070,644 | 866,300 | 658,890 | |||||
| 2010's | 446,240 | 331,442 | 268,816 | 282,599 | 289,712 | 295,980 | 292,544 | 283,271 | 315,648 | 312,093 |
| 2020's | 260,686 | 260,158 | 261,088 | 264,972 |
| - = No Data Reported; -- = Not Applicable; NA = Not Available; W = Withheld to avoid disclosure of individual company data. |
| Release Date: 8/30/2024 |
| Next Release Date: 8/29/2025 |