|
Download Data (XLS File) |
|
||||||||
|
||||||||
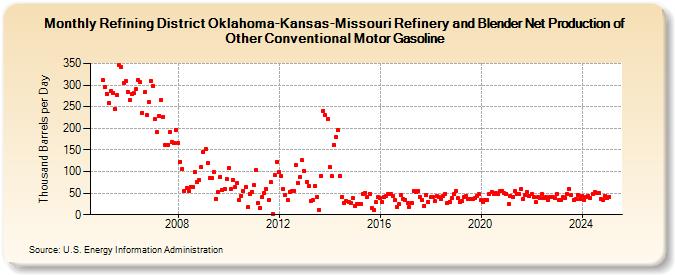
| Refining District Oklahoma-Kansas-Missouri Refinery and Blender Net Production of Other Conventional Motor Gasoline (Thousand Barrels per Day) | ||||||||
| Year | Jan | Feb | Mar | Apr | May | Jun | Jul | Aug | Sep | Oct | Nov | Dec |
|---|---|---|---|---|---|---|---|---|---|---|---|---|
| 2005 | 311 | 295 | 280 | 259 | 286 | 282 | 245 | 277 | 346 | 342 | 305 | 310 |
| 2006 | 284 | 265 | 280 | 281 | 290 | 312 | 306 | 236 | 283 | 231 | 260 | 310 |
| 2007 | 298 | 221 | 191 | 228 | 266 | 227 | 161 | 162 | 192 | 168 | 166 | 197 |
| 2008 | 166 | 122 | 106 | 56 | 62 | 54 | 65 | 63 | 99 | 76 | 80 | 110 |
| 2009 | 144 | 152 | 119 | 85 | 85 | 99 | 37 | 53 | 88 | 57 | 60 | 83 |
| 2010 | 107 | 60 | 81 | 64 | 73 | 34 | 44 | 56 | 64 | 17 | 48 | 53 |
| 2011 | 68 | 103 | 27 | 16 | 42 | 51 | 60 | 34 | 75 | 2 | 92 | 122 |
| 2012 | 98 | 90 | 59 | 45 | 34 | 53 | 56 | 56 | 114 | 74 | 88 | 126 |
| 2013 | 101 | 76 | 66 | 32 | 33 | 67 | 40 | 11 | 90 | 240 | 230 | 221 |
| 2014 | 110 | 89 | 162 | 180 | 195 | 90 | 42 | 26 | 32 | 30 | 27 | 38 |
| 2015 | 21 | 24 | 24 | 24 | 49 | 51 | 41 | 49 | 16 | 12 | 29 | 40 |
| 2016 | 38 | 29 | 40 | 44 | 48 | 48 | 44 | 34 | 19 | 24 | 45 | 37 |
| 2017 | 35 | 28 | 19 | 28 | 56 | 52 | 56 | 41 | 33 | 20 | 45 | 30 |
| 2018 | 40 | 42 | 31 | 43 | 42 | 36 | 43 | 48 | 26 | 30 | 38 | 47 |
| 2019 | 54 | 38 | 29 | 32 | 40 | 43 | 37 | 36 | 37 | 39 | 43 | 47 |
| 2020 | 34 | 29 | 34 | 35 | 47 | 53 | 48 | 51 | 49 | 54 | 55 | 50 |
| 2021 | 49 | 25 | 44 | 42 | 54 | 47 | 48 | 60 | 36 | 45 | 52 | 43 |
| 2022 | 48 | 41 | 29 | 40 | 38 | 48 | 39 | 41 | 35 | 42 | 42 | 39 |
| 2023 | 49 | 33 | 33 | 40 | 39 | 49 | 59 | 45 | 35 | 36 | 46 | 36 |
| 2024 | 44 | |||||||||||
| - = No Data Reported; -- = Not Applicable; NA = Not Available; W = Withheld to avoid disclosure of individual company data. |
| Release Date: 3/29/2024 |
| Next Release Date: 4/30/2024 |