|
Download Data (XLS File) |
|
||||||||
|
||||||||
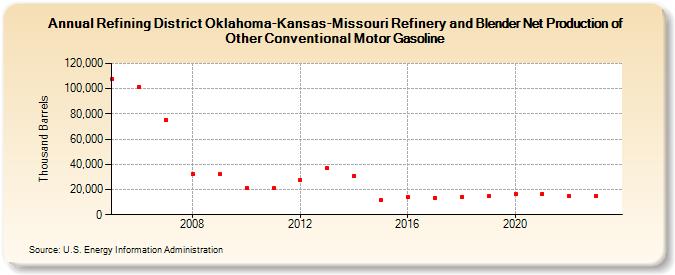
| Refining District Oklahoma-Kansas-Missouri Refinery and Blender Net Production of Other Conventional Motor Gasoline (Thousand Barrels) | ||||||||
| Decade | Year-0 | Year-1 | Year-2 | Year-3 | Year-4 | Year-5 | Year-6 | Year-7 | Year-8 | Year-9 |
|---|---|---|---|---|---|---|---|---|---|---|
| 2000's | 107,607 | 101,532 | 75,354 | 32,321 | 32,104 | |||||
| 2010's | 21,325 | 20,893 | 27,169 | 36,787 | 31,030 | 11,572 | 13,695 | 13,497 | 14,140 | 14,510 |
| 2020's | 16,470 | 16,672 | 14,632 | 15,216 |
| - = No Data Reported; -- = Not Applicable; NA = Not Available; W = Withheld to avoid disclosure of individual company data. |
| Release Date: 6/28/2024 |
| Next Release Date: 8/30/2024 |