|
Download Data (XLS File) |
|
||||||||
|
||||||||
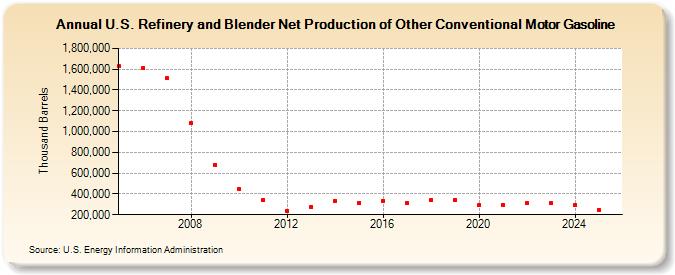
| U.S. Refinery and Blender Net Production of Other Conventional Motor Gasoline (Thousand Barrels) | ||||||||
| Decade | Year-0 | Year-1 | Year-2 | Year-3 | Year-4 | Year-5 | Year-6 | Year-7 | Year-8 | Year-9 |
|---|---|---|---|---|---|---|---|---|---|---|
| 2000's | 1,627,277 | 1,612,214 | 1,512,880 | 1,078,347 | 682,411 | |||||
| 2010's | 444,392 | 341,925 | 236,504 | 278,451 | 335,996 | 316,274 | 334,438 | 310,351 | 341,659 | 344,869 |
| 2020's | 289,831 | 295,463 | 308,241 | 308,395 |
| - = No Data Reported; -- = Not Applicable; NA = Not Available; W = Withheld to avoid disclosure of individual company data. |
| Release Date: 3/29/2024 |
| Next Release Date: 8/30/2024 |