|
Download Data (XLS File) |
|
||||||||
|
||||||||
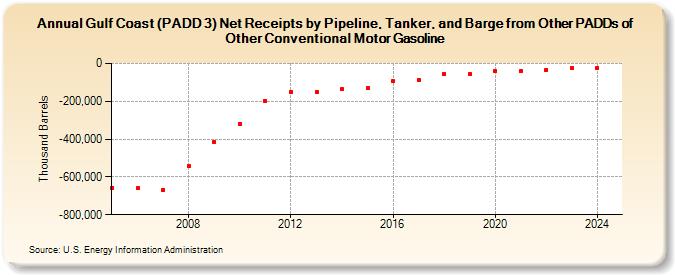
| Gulf Coast (PADD 3) Net Receipts by Pipeline, Tanker, and Barge from Other PADDs of Other Conventional Motor Gasoline (Thousand Barrels) | ||||||||
| Decade | Year-0 | Year-1 | Year-2 | Year-3 | Year-4 | Year-5 | Year-6 | Year-7 | Year-8 | Year-9 |
|---|---|---|---|---|---|---|---|---|---|---|
| 2000's | -658,091 | -659,655 | -667,428 | -542,909 | -413,931 | |||||
| 2010's | -319,495 | -198,861 | -150,843 | -151,284 | -136,579 | -131,275 | -94,285 | -85,948 | -54,775 | -55,411 |
| 2020's | -38,571 | -40,562 | -32,653 | -25,585 | -25,449 |
| - = No Data Reported; -- = Not Applicable; NA = Not Available; W = Withheld to avoid disclosure of individual company data. |
| Release Date: 6/30/2025 |
| Next Release Date: 8/29/2025 |
Referring Pages: