|
Download Data (XLS File) |
|
||||||||
|
||||||||
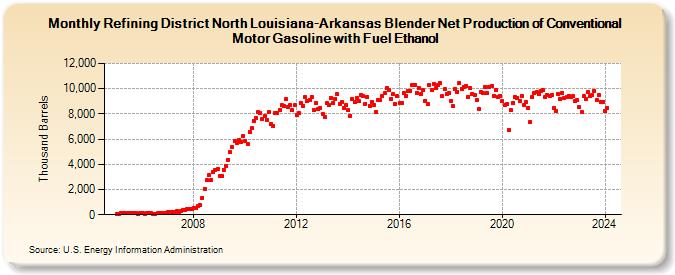
| Refining District North Louisiana-Arkansas Blender Net Production of Conventional Motor Gasoline with Fuel Ethanol (Thousand Barrels) | ||||||||
| Year | Jan | Feb | Mar | Apr | May | Jun | Jul | Aug | Sep | Oct | Nov | Dec |
|---|---|---|---|---|---|---|---|---|---|---|---|---|
| 2005 | 89 | 83 | 109 | 113 | 125 | 125 | 127 | 138 | 106 | 98 | 93 | 107 |
| 2006 | 119 | 90 | 97 | 101 | 116 | 91 | 90 | 114 | 103 | 107 | 117 | 123 |
| 2007 | 216 | 201 | 233 | 232 | 257 | 255 | 323 | 375 | 380 | 416 | 450 | 465 |
| 2008 | 555 | 556 | 712 | 761 | 1,364 | 2,073 | 2,732 | 3,127 | 2,787 | 3,409 | 3,568 | 3,628 |
| 2009 | 3,039 | 3,094 | 3,587 | 3,894 | 4,381 | 4,955 | 5,356 | 5,811 | 5,697 | 5,912 | 5,797 | 6,279 |
| 2010 | 5,817 | 5,630 | 6,545 | 6,860 | 7,467 | 7,672 | 8,125 | 8,061 | 7,610 | 7,839 | 7,554 | 8,146 |
| 2011 | 7,200 | 7,051 | 8,041 | 8,050 | 8,292 | 8,679 | 8,640 | 9,146 | 8,511 | 8,703 | 8,299 | 8,678 |
| 2012 | 7,926 | 8,057 | 8,854 | 8,650 | 9,320 | 9,061 | 9,106 | 9,371 | 8,322 | 8,873 | 8,354 | 8,428 |
| 2013 | 7,977 | 7,724 | 8,828 | 8,730 | 9,283 | 8,855 | 9,198 | 9,547 | 8,810 | 8,952 | 8,506 | 8,675 |
| 2014 | 8,305 | 7,867 | 9,195 | 8,937 | 9,260 | 8,986 | 9,514 | 9,430 | 8,808 | 9,323 | 8,664 | 8,934 |
| 2015 | 8,745 | 8,135 | 9,135 | 9,086 | 9,453 | 9,621 | 10,024 | 9,907 | 9,195 | 9,573 | 8,817 | 9,408 |
| 2016 | 8,897 | 8,843 | 9,619 | 9,443 | 9,818 | 9,844 | 10,262 | 10,315 | 9,687 | 10,030 | 9,593 | 9,857 |
| 2017 | 9,061 | 8,813 | 10,312 | 9,885 | 10,409 | 10,034 | 10,297 | 10,432 | 9,412 | 9,960 | 9,557 | 9,625 |
| 2018 | 8,989 | 8,599 | 10,002 | 9,775 | 10,467 | 10,006 | 10,137 | 10,199 | 9,376 | 10,054 | 9,559 | 9,532 |
| 2019 | 9,111 | 8,367 | 9,747 | 9,628 | 10,171 | 9,673 | 10,110 | 10,205 | 9,450 | 9,869 | 9,332 | 9,446 |
| 2020 | 9,011 | 8,701 | 8,750 | 6,688 | 8,275 | 8,895 | 9,348 | 9,294 | 9,012 | 9,402 | 8,715 | 8,934 |
| 2021 | 8,469 | 7,365 | 9,379 | 9,641 | 9,718 | 9,598 | 9,831 | 9,858 | 9,311 | 9,516 | 9,395 | 9,491 |
| 2022 | 8,473 | 8,207 | 9,549 | 9,214 | 9,696 | 9,279 | 9,342 | 9,456 | 9,305 | 9,396 | 8,999 | 9,073 |
| 2023 | 8,523 | 8,120 | 9,436 | 9,197 | 9,716 | 9,412 | 9,477 | 9,831 | 9,101 | 9,477 | 8,970 | 8,966 |
| 2024 | 8,214 | |||||||||||
| - = No Data Reported; -- = Not Applicable; NA = Not Available; W = Withheld to avoid disclosure of individual company data. |
| Release Date: 3/29/2024 |
| Next Release Date: 4/30/2024 |