|
Download Data (XLS File) |
|
||||||||
|
||||||||
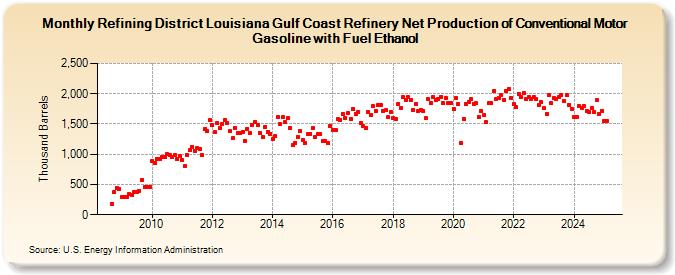
| Refining District Louisiana Gulf Coast Refinery Net Production of Conventional Motor Gasoline with Fuel Ethanol (Thousand Barrels) | ||||||||
| Year | Jan | Feb | Mar | Apr | May | Jun | Jul | Aug | Sep | Oct | Nov | Dec |
|---|---|---|---|---|---|---|---|---|---|---|---|---|
| 2008 | 185 | 375 | 438 | 426 | ||||||||
| 2009 | 291 | 299 | 293 | 338 | 325 | 368 | 379 | 397 | 578 | 454 | 458 | 460 |
| 2010 | 888 | 858 | 929 | 919 | 946 | 948 | 1,005 | 984 | 956 | 985 | 918 | 967 |
| 2011 | 902 | 804 | 988 | 1,068 | 1,126 | 1,057 | 1,101 | 1,086 | 986 | 1,421 | 1,387 | 1,559 |
| 2012 | 1,475 | 1,361 | 1,517 | 1,439 | 1,507 | 1,563 | 1,513 | 1,380 | 1,261 | 1,426 | 1,344 | 1,343 |
| 2013 | 1,368 | 1,221 | 1,423 | 1,353 | 1,488 | 1,540 | 1,486 | 1,355 | 1,279 | 1,449 | 1,373 | 1,339 |
| 2014 | 1,249 | 1,293 | 1,609 | 1,499 | 1,611 | 1,529 | 1,596 | 1,436 | 1,150 | 1,188 | 1,289 | 1,381 |
| 2015 | 1,242 | 1,183 | 1,332 | 1,340 | 1,439 | 1,288 | 1,334 | 1,328 | 1,216 | 1,218 | 1,178 | 1,465 |
| 2016 | 1,404 | 1,408 | 1,579 | 1,572 | 1,665 | 1,598 | 1,685 | 1,583 | 1,746 | 1,673 | 1,698 | 1,524 |
| 2017 | 1,473 | 1,433 | 1,696 | 1,656 | 1,789 | 1,715 | 1,807 | 1,820 | 1,708 | 1,724 | 1,609 | 1,698 |
| 2018 | 1,602 | 1,589 | 1,836 | 1,766 | 1,942 | 1,895 | 1,943 | 1,889 | 1,733 | 1,827 | 1,712 | 1,738 |
| 2019 | 1,714 | 1,598 | 1,913 | 1,848 | 1,945 | 1,895 | 1,920 | 1,950 | 1,842 | 1,928 | 1,850 | 1,841 |
| 2020 | 1,752 | 1,937 | 1,829 | 1,183 | 1,585 | 1,824 | 1,858 | 1,912 | 1,837 | 1,839 | 1,623 | 1,722 |
| 2021 | 1,641 | 1,528 | 1,846 | 1,842 | 2,045 | 1,914 | 1,928 | 1,971 | 1,897 | 2,047 | 2,070 | 1,931 |
| 2022 | 1,825 | 1,774 | 2,001 | 1,948 | 2,018 | 1,912 | 1,939 | 1,920 | 1,948 | 1,912 | 1,809 | 1,856 |
| 2023 | 1,761 | 1,670 | 1,983 | 1,843 | 1,934 | 1,915 | 1,954 | 1,977 | 1,881 | 1,971 | 1,812 | 1,753 |
| 2024 | 1,618 | |||||||||||
| - = No Data Reported; -- = Not Applicable; NA = Not Available; W = Withheld to avoid disclosure of individual company data. |
| Release Date: 3/29/2024 |
| Next Release Date: 4/30/2024 |