|
Download Data (XLS File) |
|
||||||||
|
||||||||
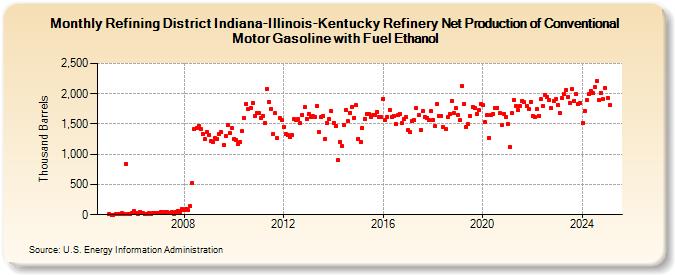
| Refining District Indiana-Illinois-Kentucky Refinery Net Production of Conventional Motor Gasoline with Fuel Ethanol (Thousand Barrels) | ||||||||
| Year | Jan | Feb | Mar | Apr | May | Jun | Jul | Aug | Sep | Oct | Nov | Dec |
|---|---|---|---|---|---|---|---|---|---|---|---|---|
| 2005 | 11 | 3 | 3 | 11 | 12 | 17 | 21 | 18 | 843 | 18 | 4 | 22 |
| 2006 | 56 | 35 | 17 | 50 | 24 | 5 | 8 | 28 | 16 | 28 | 36 | 34 |
| 2007 | 36 | 52 | 29 | 46 | 46 | 24 | 42 | 18 | 52 | 68 | 48 | 96 |
| 2008 | 83 | 100 | 75 | 141 | 519 | 1,422 | 1,430 | 1,473 | 1,413 | 1,336 | 1,245 | 1,368 |
| 2009 | 1,326 | 1,211 | 1,207 | 1,266 | 1,252 | 1,338 | 1,366 | 1,148 | 1,300 | 1,478 | 1,350 | 1,426 |
| 2010 | 1,249 | 1,239 | 1,164 | 1,200 | 1,377 | 1,602 | 1,835 | 1,741 | 1,760 | 1,854 | 1,629 | 1,682 |
| 2011 | 1,676 | 1,600 | 1,639 | 1,514 | 2,086 | 1,867 | 1,749 | 1,336 | 1,675 | 1,260 | 1,598 | 1,566 |
| 2012 | 1,455 | 1,332 | 1,312 | 1,288 | 1,319 | 1,578 | 1,559 | 1,577 | 1,513 | 1,655 | 1,776 | 1,590 |
| 2013 | 1,666 | 1,623 | 1,630 | 1,617 | 1,799 | 1,365 | 1,611 | 1,636 | 1,258 | 1,519 | 1,579 | 1,711 |
| 2014 | 1,519 | 1,463 | 905 | 1,201 | 1,144 | 1,479 | 1,728 | 1,543 | 1,687 | 1,788 | 1,603 | 1,809 |
| 2015 | 1,259 | 1,207 | 1,437 | 1,585 | 1,663 | 1,663 | 1,619 | 1,645 | 1,651 | 1,706 | 1,612 | 1,609 |
| 2016 | 1,918 | 1,562 | 1,622 | 1,738 | 1,622 | 1,638 | 1,494 | 1,643 | 1,672 | 1,508 | 1,584 | 1,614 |
| 2017 | 1,408 | 1,360 | 1,547 | 1,563 | 1,760 | 1,647 | 1,405 | 1,708 | 1,621 | 1,600 | 1,560 | 1,710 |
| 2018 | 1,564 | 1,459 | 1,833 | 1,626 | 1,624 | 1,448 | 1,424 | 1,611 | 1,663 | 1,885 | 1,682 | 1,761 |
| 2019 | 1,651 | 1,558 | 2,128 | 1,833 | 1,450 | 1,493 | 1,633 | 1,786 | 1,765 | 1,673 | 1,723 | 1,836 |
| 2020 | 1,808 | 1,526 | 1,642 | 1,271 | 1,648 | 1,670 | 1,767 | 1,770 | 1,676 | 1,483 | 1,666 | 1,622 |
| 2021 | 1,498 | 1,120 | 1,675 | 1,895 | 1,799 | 1,725 | 1,800 | 1,880 | 1,858 | 1,805 | 1,746 | 1,864 |
| 2022 | 1,632 | 1,611 | 1,741 | 1,634 | 1,905 | 1,805 | 1,983 | 1,949 | 1,896 | 1,762 | 1,885 | 1,906 |
| 2023 | 1,820 | 1,682 | 1,923 | 1,988 | 2,064 | 1,952 | 1,843 | 2,076 | 1,885 | 1,991 | 1,838 | 1,854 |
| 2024 | 1,519 | |||||||||||
| - = No Data Reported; -- = Not Applicable; NA = Not Available; W = Withheld to avoid disclosure of individual company data. |
| Release Date: 3/29/2024 |
| Next Release Date: 4/30/2024 |