|
Download Data (XLS File) |
|
||||||||
|
||||||||
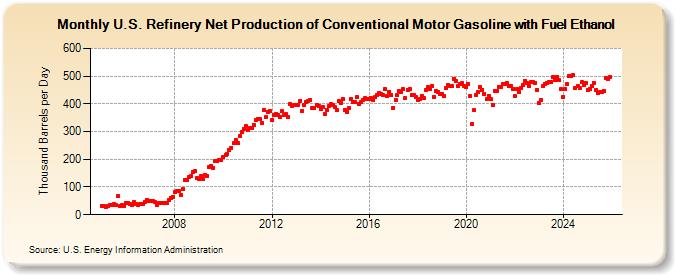
| U.S. Refinery Net Production of Conventional Motor Gasoline with Fuel Ethanol (Thousand Barrels per Day) | ||||||||
| Year | Jan | Feb | Mar | Apr | May | Jun | Jul | Aug | Sep | Oct | Nov | Dec |
|---|---|---|---|---|---|---|---|---|---|---|---|---|
| 2005 | 32 | 31 | 29 | 30 | 34 | 35 | 37 | 34 | 66 | 31 | 35 | 33 |
| 2006 | 43 | 42 | 38 | 34 | 45 | 39 | 34 | 37 | 39 | 46 | 54 | 51 |
| 2007 | 51 | 49 | 45 | 36 | 43 | 44 | 44 | 41 | 44 | 54 | 61 | 65 |
| 2008 | 81 | 86 | 84 | 72 | 91 | 127 | 127 | 137 | 139 | 154 | 158 | 132 |
| 2009 | 130 | 139 | 128 | 145 | 139 | 171 | 176 | 170 | 192 | 193 | 197 | 199 |
| 2010 | 207 | 217 | 220 | 233 | 242 | 258 | 270 | 257 | 285 | 297 | 311 | 319 |
| 2011 | 305 | 312 | 314 | 325 | 340 | 347 | 347 | 332 | 379 | 354 | 371 | 373 |
| 2012 | 342 | 358 | 365 | 359 | 352 | 373 | 361 | 363 | 353 | 400 | 392 | 397 |
| 2013 | 395 | 396 | 412 | 374 | 394 | 408 | 412 | 414 | 384 | 386 | 395 | 391 |
| 2014 | 381 | 387 | 364 | 379 | 391 | 398 | 395 | 387 | 376 | 410 | 404 | 418 |
| 2015 | 379 | 371 | 384 | 419 | 407 | 405 | 424 | 401 | 405 | 415 | 420 | 419 |
| 2016 | 418 | 421 | 415 | 423 | 433 | 440 | 434 | 431 | 453 | 427 | 444 | 431 |
| 2017 | 385 | 413 | 431 | 445 | 444 | 452 | 421 | 451 | 452 | 431 | 431 | 423 |
| 2018 | 414 | 416 | 430 | 421 | 449 | 459 | 454 | 463 | 426 | 448 | 443 | 436 |
| 2019 | 437 | 429 | 457 | 468 | 466 | 463 | 491 | 483 | 464 | 472 | 474 | 466 |
| 2020 | 460 | 472 | 429 | 329 | 376 | 432 | 442 | 459 | 451 | 435 | 416 | 430 |
| 2021 | 418 | 396 | 448 | 446 | 461 | 462 | 471 | 471 | 476 | 466 | 466 | 455 |
| 2022 | 430 | 453 | 444 | 457 | 467 | 484 | 474 | 465 | 479 | 477 | 476 | 450 |
| 2023 | 402 | 414 | 464 | 473 | 475 | 490 | 478 | 496 | 485 | 496 | 485 | 452 |
| 2024 | 427 | 454 | ||||||||||
| - = No Data Reported; -- = Not Applicable; NA = Not Available; W = Withheld to avoid disclosure of individual company data. |
| Release Date: 4/30/2024 |
| Next Release Date: 5/31/2024 |