|
Download Data (XLS File) |
|
||||||||
|
||||||||
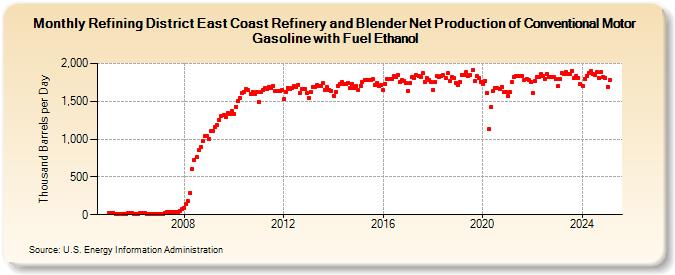
| Refining District East Coast Refinery and Blender Net Production of Conventional Motor Gasoline with Fuel Ethanol (Thousand Barrels per Day) | ||||||||
| Year | Jan | Feb | Mar | Apr | May | Jun | Jul | Aug | Sep | Oct | Nov | Dec |
|---|---|---|---|---|---|---|---|---|---|---|---|---|
| 2005 | 22 | 22 | 24 | 3 | 3 | 5 | 6 | 6 | 6 | 21 | 21 | 20 |
| 2006 | 14 | 16 | 15 | 20 | 24 | 19 | 16 | 14 | 12 | 12 | 12 | 12 |
| 2007 | 11 | 11 | 11 | 27 | 31 | 32 | 33 | 34 | 32 | 39 | 51 | 71 |
| 2008 | 87 | 138 | 178 | 290 | 605 | 725 | 759 | 855 | 896 | 978 | 1,038 | 1,037 |
| 2009 | 1,006 | 1,105 | 1,109 | 1,158 | 1,193 | 1,257 | 1,312 | 1,320 | 1,297 | 1,349 | 1,332 | 1,376 |
| 2010 | 1,337 | 1,431 | 1,501 | 1,550 | 1,613 | 1,628 | 1,662 | 1,647 | 1,599 | 1,626 | 1,598 | 1,622 |
| 2011 | 1,493 | 1,628 | 1,649 | 1,674 | 1,656 | 1,691 | 1,681 | 1,703 | 1,633 | 1,634 | 1,630 | 1,643 |
| 2012 | 1,525 | 1,628 | 1,682 | 1,658 | 1,680 | 1,698 | 1,693 | 1,720 | 1,609 | 1,669 | 1,656 | 1,605 |
| 2013 | 1,540 | 1,624 | 1,688 | 1,693 | 1,715 | 1,699 | 1,696 | 1,742 | 1,643 | 1,686 | 1,653 | 1,642 |
| 2014 | 1,571 | 1,628 | 1,702 | 1,727 | 1,755 | 1,723 | 1,726 | 1,747 | 1,671 | 1,730 | 1,674 | 1,698 |
| 2015 | 1,648 | 1,700 | 1,756 | 1,782 | 1,782 | 1,777 | 1,784 | 1,790 | 1,714 | 1,743 | 1,700 | 1,709 |
| 2016 | 1,644 | 1,734 | 1,795 | 1,795 | 1,801 | 1,831 | 1,826 | 1,848 | 1,754 | 1,777 | 1,766 | 1,745 |
| 2017 | 1,641 | 1,740 | 1,824 | 1,813 | 1,842 | 1,841 | 1,824 | 1,874 | 1,756 | 1,806 | 1,780 | 1,757 |
| 2018 | 1,654 | 1,755 | 1,833 | 1,818 | 1,829 | 1,844 | 1,810 | 1,868 | 1,769 | 1,822 | 1,805 | 1,744 |
| 2019 | 1,712 | 1,756 | 1,847 | 1,851 | 1,881 | 1,837 | 1,846 | 1,913 | 1,762 | 1,833 | 1,807 | 1,760 |
| 2020 | 1,725 | 1,766 | 1,604 | 1,132 | 1,427 | 1,640 | 1,679 | 1,674 | 1,663 | 1,688 | 1,625 | 1,625 |
| 2021 | 1,564 | 1,619 | 1,760 | 1,817 | 1,837 | 1,833 | 1,836 | 1,836 | 1,781 | 1,794 | 1,786 | 1,752 |
| 2022 | 1,607 | 1,773 | 1,817 | 1,817 | 1,857 | 1,831 | 1,800 | 1,863 | 1,820 | 1,820 | 1,816 | 1,792 |
| 2023 | 1,697 | 1,790 | 1,863 | 1,851 | 1,884 | 1,860 | 1,856 | 1,899 | 1,804 | 1,838 | 1,813 | 1,724 |
| 2024 | 1,703 | |||||||||||
| - = No Data Reported; -- = Not Applicable; NA = Not Available; W = Withheld to avoid disclosure of individual company data. |
| Release Date: 3/29/2024 |
| Next Release Date: 4/30/2024 |