|
Download Data (XLS File) |
|
||||||||
|
||||||||
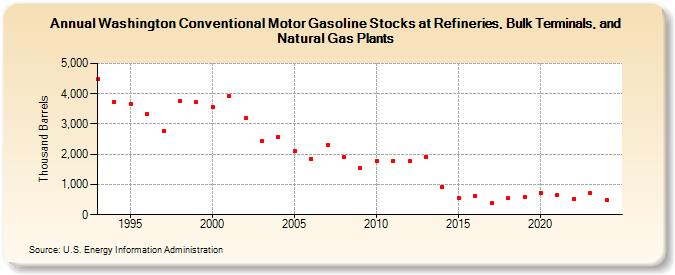
| Washington Conventional Motor Gasoline Stocks at Refineries, Bulk Terminals, and Natural Gas Plants (Thousand Barrels) | ||||||||
| Decade | Year-0 | Year-1 | Year-2 | Year-3 | Year-4 | Year-5 | Year-6 | Year-7 | Year-8 | Year-9 |
|---|---|---|---|---|---|---|---|---|---|---|
| 1990's | 4,486 | 3,740 | 3,675 | 3,315 | 2,777 | 3,752 | 3,711 | |||
| 2000's | 3,565 | 3,927 | 3,198 | 2,422 | 2,568 | 2,108 | 1,837 | 2,312 | 1,902 | 1,531 |
| 2010's | 1,776 | 1,792 | 1,770 | 1,920 | 902 | 545 | 612 | 383 | 539 | 591 |
| 2020's | 728 | 654 | 533 | 724 |
| - = No Data Reported; -- = Not Applicable; NA = Not Available; W = Withheld to avoid disclosure of individual company data. |
| Release Date: 8/30/2024 |
| Next Release Date: 8/29/2025 |