|
Download Data (XLS File) |
|
||||||||
|
||||||||
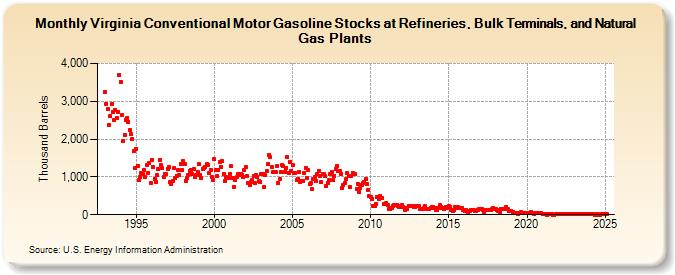
| Virginia Conventional Motor Gasoline Stocks at Refineries, Bulk Terminals, and Natural Gas Plants (Thousand Barrels) | ||||||||
| Year | Jan | Feb | Mar | Apr | May | Jun | Jul | Aug | Sep | Oct | Nov | Dec |
|---|---|---|---|---|---|---|---|---|---|---|---|---|
| 1993 | 3,244 | 2,941 | 2,802 | 2,370 | 2,601 | 2,925 | 2,724 | 2,502 | 2,770 | 2,563 | 2,726 | 3,691 |
| 1994 | 3,514 | 2,640 | 1,950 | 2,119 | 2,508 | 2,569 | 2,463 | 2,241 | 2,124 | 2,009 | 1,685 | 1,234 |
| 1995 | 1,740 | 1,283 | 909 | 990 | 1,104 | 1,087 | 1,178 | 998 | 1,315 | 1,108 | 1,369 | 836 |
| 1996 | 1,458 | 1,266 | 945 | 872 | 1,056 | 1,196 | 1,448 | 1,309 | 1,227 | 997 | 1,069 | 1,073 |
| 1997 | 1,222 | 1,269 | 858 | 825 | 890 | 1,226 | 972 | 1,031 | 1,177 | 1,046 | 1,345 | 1,188 |
| 1998 | 1,423 | 1,330 | 892 | 969 | 1,062 | 1,163 | 1,183 | 1,080 | 1,213 | 996 | 1,049 | 1,129 |
| 1999 | 1,334 | 1,045 | 964 | 1,209 | 1,226 | 1,267 | 1,330 | 1,327 | 1,096 | 1,189 | 1,004 | 928 |
| 2000 | 1,461 | 1,171 | 1,029 | 1,179 | 1,400 | 1,273 | 1,422 | 1,074 | 895 | 990 | 982 | 982 |
| 2001 | 1,077 | 1,277 | 978 | 741 | 908 | 988 | 1,070 | 1,048 | 1,086 | 1,050 | 1,010 | 1,184 |
| 2002 | 1,249 | 1,027 | 826 | 793 | 859 | 926 | 1,014 | 831 | 1,061 | 996 | 882 | 869 |
| 2003 | 1,065 | 1,088 | 728 | 1,041 | 1,150 | 1,333 | 1,573 | 1,533 | 1,257 | 1,117 | 1,132 | 1,141 |
| 2004 | 1,294 | 836 | 936 | 1,123 | 1,303 | 1,280 | 1,133 | 1,242 | 1,525 | 1,113 | 1,395 | 1,157 |
| 2005 | 1,315 | 1,105 | 1,097 | 918 | 955 | 1,137 | 868 | 899 | 901 | 1,110 | 1,246 | 977 |
| 2006 | 1,175 | 803 | 836 | 669 | 937 | 1,007 | 898 | 1,067 | 1,160 | 1,013 | 857 | 1,066 |
| 2007 | 1,069 | 1,015 | 757 | 834 | 920 | 1,070 | 1,140 | 916 | 1,035 | 1,212 | 1,301 | 1,167 |
| 2008 | 1,151 | 1,085 | 709 | 782 | 838 | 936 | 1,097 | 1,022 | 746 | 1,015 | 1,097 | 1,086 |
| 2009 | 1,071 | 687 | 821 | 613 | 716 | 799 | 827 | 875 | 938 | 819 | 661 | 489 |
| 2010 | 468 | 410 | 240 | 220 | 295 | 469 | 427 | 489 | 449 | 448 | 283 | 274 |
| 2011 | 317 | 261 | 146 | 148 | 180 | 218 | 257 | 256 | 266 | 242 | 211 | 213 |
| 2012 | 260 | 201 | 136 | 173 | 154 | 239 | 236 | 224 | 239 | 194 | 200 | 235 |
| 2013 | 231 | 220 | 156 | 157 | 156 | 183 | 223 | 163 | 138 | 147 | 188 | 214 |
| 2014 | 210 | 182 | 118 | 133 | 167 | 247 | 216 | 169 | 147 | 176 | 193 | 189 |
| 2015 | 226 | 205 | 137 | 89 | 128 | 196 | 187 | 192 | 178 | 167 | 176 | 134 |
| 2016 | 105 | 127 | 109 | 66 | 103 | 122 | 130 | 122 | 101 | 95 | 123 | 150 |
| 2017 | 141 | 149 | 127 | 79 | 114 | 118 | 128 | 137 | 113 | 138 | 166 | 150 |
| 2018 | 141 | 135 | 98 | 78 | 161 | 146 | 164 | 151 | 193 | 140 | 111 | 91 |
| 2019 | 96 | 78 | 55 | 37 | 33 | 30 | 52 | 65 | 54 | 55 | 57 | 44 |
| 2020 | 54 | 36 | 41 | 59 | 44 | 31 | 41 | 43 | 33 | 34 | 47 | 41 |
| 2021 | 20 | 19 | 12 | 5 | 23 | 8 | 9 | 6 | 5 | 4 | 12 | 29 |
| 2022 | 18 | 13 | 18 | 14 | 14 | 8 | 6 | 7 | 15 | 16 | 9 | 22 |
| 2023 | 23 | 24 | 8 | 8 | 28 | 15 | 9 | 31 | 21 | 20 | 13 | 21 |
| 2024 | 25 | |||||||||||
| - = No Data Reported; -- = Not Applicable; NA = Not Available; W = Withheld to avoid disclosure of individual company data. |
| Release Date: 3/29/2024 |
| Next Release Date: 4/30/2024 |