|
Download Data (XLS File) |
|
||||||||
|
||||||||
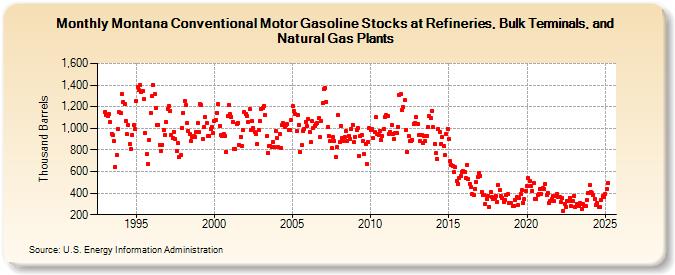
| Montana Conventional Motor Gasoline Stocks at Refineries, Bulk Terminals, and Natural Gas Plants (Thousand Barrels) | ||||||||
| Year | Jan | Feb | Mar | Apr | May | Jun | Jul | Aug | Sep | Oct | Nov | Dec |
|---|---|---|---|---|---|---|---|---|---|---|---|---|
| 1993 | 1,151 | 1,120 | 1,117 | 1,130 | 1,057 | 951 | 934 | 882 | 644 | 753 | 995 | 1,147 |
| 1994 | 1,141 | 1,317 | 1,243 | 1,223 | 1,070 | 943 | 1,028 | 854 | 805 | 939 | 1,030 | 997 |
| 1995 | 1,254 | 1,385 | 1,356 | 1,398 | 1,337 | 1,348 | 1,267 | 954 | 758 | 674 | 894 | 1,146 |
| 1996 | 1,295 | 1,400 | 1,317 | 1,192 | 1,030 | 1,031 | 849 | 791 | 849 | 983 | 941 | 1,060 |
| 1997 | 1,178 | 1,205 | 1,160 | 939 | 907 | 970 | 899 | 787 | 862 | 732 | 750 | 1,006 |
| 1998 | 1,145 | 1,249 | 1,212 | 1,050 | 975 | 945 | 878 | 916 | 925 | 924 | 969 | 1,049 |
| 1999 | 966 | 1,224 | 1,217 | 902 | 1,009 | 1,106 | 1,047 | 926 | 931 | 994 | 1,014 | 960 |
| 2000 | 1,069 | 1,076 | 1,145 | 1,221 | 1,024 | 940 | 926 | 948 | 931 | 785 | 1,110 | 1,214 |
| 2001 | 1,129 | 1,105 | 1,062 | 812 | 810 | 1,040 | 1,051 | 845 | 922 | 840 | 982 | 1,149 |
| 2002 | 1,136 | 1,111 | 1,061 | 1,174 | 981 | 1,066 | 1,001 | 967 | 944 | 859 | 982 | 1,068 |
| 2003 | 1,174 | 1,185 | 1,209 | 1,123 | 928 | 775 | 837 | 835 | 828 | 876 | 825 | 971 |
| 2004 | 912 | 825 | 947 | 818 | 1,032 | 1,045 | 1,016 | 1,033 | 1,036 | 987 | 984 | 1,074 |
| 2005 | 1,205 | 1,157 | 1,134 | 975 | 1,121 | 1,029 | 781 | 846 | 978 | 993 | 1,062 | 1,017 |
| 2006 | 1,087 | 967 | 869 | 1,064 | 1,006 | 1,024 | 1,043 | 1,049 | 1,093 | 919 | 1,071 | 1,231 |
| 2007 | 1,361 | 1,369 | 1,247 | 1,010 | 928 | 884 | 813 | 916 | 882 | 734 | 827 | 1,122 |
| 2008 | 873 | 1,022 | 910 | 887 | 921 | 973 | 881 | 931 | 901 | 996 | 1,033 | 872 |
| 2009 | 924 | 981 | 1,004 | 744 | 931 | 940 | 878 | 760 | 851 | 673 | 874 | 1,002 |
| 2010 | 981 | 992 | 908 | 963 | 1,102 | 949 | 934 | 978 | 894 | 929 | 997 | 1,106 |
| 2011 | 1,119 | 1,117 | 951 | 970 | 1,028 | 945 | 901 | 955 | 959 | 1,012 | 1,311 | 1,313 |
| 2012 | 1,171 | 1,195 | 1,261 | 987 | 784 | 931 | 878 | 879 | 893 | 1,039 | 1,053 | 1,101 |
| 2013 | 1,040 | 935 | 881 | 938 | 861 | 929 | 878 | 933 | 1,008 | 1,114 | 1,096 | 1,163 |
| 2014 | 1,009 | 856 | 768 | 719 | 993 | 969 | 859 | 916 | 839 | 752 | 949 | 997 |
| 2015 | 899 | 693 | 663 | 651 | 592 | 639 | 508 | 485 | 539 | 560 | 597 | 601 |
| 2016 | 594 | 536 | 663 | 526 | 487 | 455 | 390 | 380 | 442 | 506 | 548 | 588 |
| 2017 | 562 | 414 | 381 | 378 | 300 | 347 | 375 | 273 | 407 | 362 | 342 | 357 |
| 2018 | 373 | 321 | 475 | 430 | 372 | 356 | 316 | 337 | 385 | 388 | 307 | 308 |
| 2019 | 305 | 283 | 281 | 335 | 360 | 292 | 355 | 391 | 428 | 311 | 343 | 417 |
| 2020 | 467 | 536 | 509 | 470 | 422 | 495 | 345 | 350 | 378 | 391 | 439 | 390 |
| 2021 | 443 | 440 | 483 | 380 | 401 | 313 | 329 | 345 | 376 | 326 | 371 | 396 |
| 2022 | 367 | 364 | 315 | 352 | 237 | 302 | 270 | 328 | 326 | 358 | 278 | 327 |
| 2023 | 376 | 271 | 295 | 294 | 284 | 309 | 251 | 292 | 275 | 282 | 335 | 393 |
| 2024 | 477 | |||||||||||
| - = No Data Reported; -- = Not Applicable; NA = Not Available; W = Withheld to avoid disclosure of individual company data. |
| Release Date: 3/29/2024 |
| Next Release Date: 4/30/2024 |