|
Download Data (XLS File) |
|
||||||||
|
||||||||
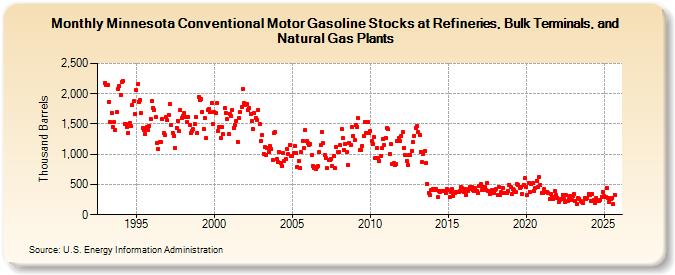
| Minnesota Conventional Motor Gasoline Stocks at Refineries, Bulk Terminals, and Natural Gas Plants (Thousand Barrels) | ||||||||
| Year | Jan | Feb | Mar | Apr | May | Jun | Jul | Aug | Sep | Oct | Nov | Dec |
|---|---|---|---|---|---|---|---|---|---|---|---|---|
| 1993 | 2,181 | 2,143 | 2,141 | 1,870 | 1,533 | 1,687 | 1,452 | 1,528 | 1,406 | 1,695 | 2,079 | 2,127 |
| 1994 | 1,982 | 2,194 | 2,213 | 1,506 | 1,502 | 1,454 | 1,352 | 1,520 | 1,461 | 1,814 | 1,875 | 1,663 |
| 1995 | 2,063 | 2,155 | 1,871 | 1,896 | 1,676 | 1,427 | 1,404 | 1,331 | 1,446 | 1,408 | 1,473 | 1,588 |
| 1996 | 1,876 | 1,771 | 1,739 | 1,613 | 1,184 | 1,087 | 1,198 | 1,200 | 1,585 | 1,354 | 1,320 | 1,617 |
| 1997 | 1,560 | 1,652 | 1,831 | 1,478 | 1,356 | 1,302 | 1,106 | 1,439 | 1,557 | 1,379 | 1,727 | 1,592 |
| 1998 | 1,626 | 1,688 | 1,614 | 1,531 | 1,611 | 1,490 | 1,350 | 1,383 | 1,409 | 1,501 | 1,613 | 1,357 |
| 1999 | 1,945 | 1,903 | 1,908 | 1,704 | 1,422 | 1,594 | 1,264 | 1,726 | 1,752 | 1,692 | 1,853 | 1,501 |
| 2000 | 1,694 | 1,680 | 1,840 | 1,391 | 1,453 | 1,261 | 1,451 | 1,327 | 1,757 | 1,689 | 1,578 | 1,330 |
| 2001 | 1,667 | 1,630 | 1,728 | 1,430 | 1,476 | 1,552 | 1,208 | 1,596 | 1,700 | 1,783 | 2,081 | 1,843 |
| 2002 | 1,814 | 1,835 | 1,731 | 1,764 | 1,661 | 1,549 | 1,414 | 1,681 | 1,604 | 1,570 | 1,732 | 1,501 |
| 2003 | 1,211 | 1,313 | 1,008 | 1,112 | 987 | 1,104 | 1,032 | 1,128 | 1,085 | 906 | 1,352 | 1,368 |
| 2004 | 920 | 872 | 1,040 | 850 | 799 | 1,023 | 892 | 917 | 1,082 | 1,003 | 1,153 | 976 |
| 2005 | 967 | 1,018 | 1,138 | 1,021 | 788 | 893 | 780 | 1,030 | 1,220 | 1,110 | 1,393 | 1,212 |
| 2006 | 1,186 | 1,154 | 1,168 | 988 | 807 | 768 | 754 | 797 | 803 | 1,038 | 1,146 | 1,374 |
| 2007 | 1,180 | 988 | 934 | 769 | 899 | 900 | 927 | 804 | 964 | 766 | 1,113 | 1,032 |
| 2008 | 1,034 | 1,152 | 1,414 | 1,270 | 1,071 | 1,171 | 1,042 | 822 | 1,185 | 1,157 | 1,457 | 1,305 |
| 2009 | 1,241 | 1,478 | 1,457 | 1,593 | 1,070 | 1,068 | 1,136 | 1,304 | 1,539 | 1,349 | 1,526 | 1,349 |
| 2010 | 1,388 | 1,211 | 1,174 | 1,281 | 931 | 1,103 | 931 | 885 | 963 | 1,095 | 1,250 | 1,145 |
| 2011 | 1,275 | 1,431 | 1,409 | 1,001 | 1,161 | 833 | 847 | 830 | 836 | 1,218 | 1,260 | 1,217 |
| 2012 | 1,306 | 1,362 | 1,108 | 985 | 886 | 824 | 986 | 991 | 1,052 | 1,201 | 1,307 | 1,437 |
| 2013 | 1,468 | 1,363 | 1,322 | 1,042 | 871 | 1,004 | 1,052 | 853 | 516 | 364 | 331 | 404 |
| 2014 | 423 | 429 | 409 | 420 | 288 | 393 | 377 | 386 | 389 | 384 | 351 | 432 |
| 2015 | 407 | 287 | 382 | 424 | 315 | 364 | 380 | 371 | 378 | 384 | 455 | 434 |
| 2016 | 374 | 424 | 328 | 392 | 421 | 461 | 455 | 401 | 397 | 439 | 392 | 359 |
| 2017 | 479 | 500 | 413 | 451 | 450 | 401 | 529 | 385 | 337 | 385 | 403 | 363 |
| 2018 | 413 | 429 | 331 | 455 | 334 | 369 | 446 | 352 | 355 | 363 | 386 | 498 |
| 2019 | 452 | 344 | 421 | 404 | 382 | 506 | 498 | 442 | 456 | 348 | 496 | 601 |
| 2020 | 460 | 332 | 528 | 381 | 503 | 519 | 397 | 441 | 562 | 453 | 621 | 499 |
| 2021 | 360 | 362 | 417 | 374 | 382 | 359 | 256 | 350 | 299 | 264 | 384 | 318 |
| 2022 | 283 | 216 | 244 | 263 | 327 | 256 | 205 | 318 | 229 | 252 | 302 | 251 |
| 2023 | 310 | 340 | 229 | 180 | 277 | 261 | 226 | 212 | 198 | 274 | 257 | 273 |
| 2024 | 349 | |||||||||||
| - = No Data Reported; -- = Not Applicable; NA = Not Available; W = Withheld to avoid disclosure of individual company data. |
| Release Date: 3/29/2024 |
| Next Release Date: 4/30/2024 |