|
Download Data (XLS File) |
|
||||||||
|
||||||||
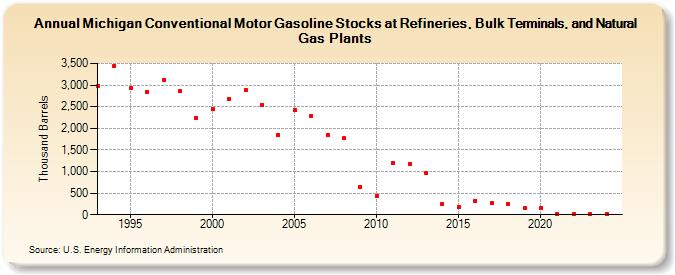
| Michigan Conventional Motor Gasoline Stocks at Refineries, Bulk Terminals, and Natural Gas Plants (Thousand Barrels) | ||||||||
| Decade | Year-0 | Year-1 | Year-2 | Year-3 | Year-4 | Year-5 | Year-6 | Year-7 | Year-8 | Year-9 |
|---|---|---|---|---|---|---|---|---|---|---|
| 1990's | 2,979 | 3,450 | 2,924 | 2,840 | 3,126 | 2,861 | 2,245 | |||
| 2000's | 2,437 | 2,679 | 2,889 | 2,545 | 1,848 | 2,428 | 2,279 | 1,849 | 1,772 | 646 |
| 2010's | 423 | 1,195 | 1,174 | 963 | 239 | 185 | 319 | 266 | 252 | 155 |
| 2020's | 153 | 10 | 12 | 11 |
| - = No Data Reported; -- = Not Applicable; NA = Not Available; W = Withheld to avoid disclosure of individual company data. |
| Release Date: 8/30/2024 |
| Next Release Date: 8/29/2025 |