|
Download Data (XLS File) |
|
||||||||
|
||||||||
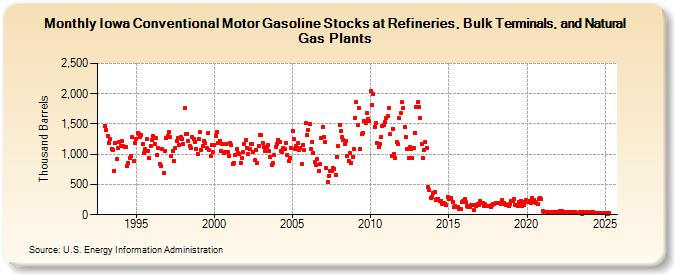
| Iowa Conventional Motor Gasoline Stocks at Refineries, Bulk Terminals, and Natural Gas Plants (Thousand Barrels) | ||||||||
| Year | Jan | Feb | Mar | Apr | May | Jun | Jul | Aug | Sep | Oct | Nov | Dec |
|---|---|---|---|---|---|---|---|---|---|---|---|---|
| 1993 | 1,459 | 1,393 | 1,306 | 1,179 | 1,254 | 1,091 | 1,068 | 727 | 1,180 | 914 | 1,111 | 1,199 |
| 1994 | 1,133 | 1,213 | 1,130 | 1,113 | 1,127 | 804 | 858 | 942 | 975 | 1,284 | 887 | 1,188 |
| 1995 | 1,249 | 1,354 | 1,330 | 1,282 | 1,317 | 1,166 | 1,026 | 1,080 | 1,246 | 1,059 | 944 | 1,141 |
| 1996 | 1,231 | 1,303 | 1,172 | 1,268 | 985 | 1,095 | 839 | 799 | 1,079 | 694 | 1,051 | 1,266 |
| 1997 | 1,298 | 1,366 | 1,282 | 978 | 1,049 | 892 | 1,097 | 1,212 | 1,272 | 1,159 | 1,286 | 1,257 |
| 1998 | 1,163 | 1,757 | 1,342 | 1,341 | 1,217 | 1,142 | 1,103 | 1,281 | 1,251 | 1,203 | 1,091 | 996 |
| 1999 | 1,248 | 1,367 | 1,063 | 1,137 | 1,222 | 1,179 | 1,099 | 1,348 | 1,068 | 969 | 1,154 | 1,040 |
| 2000 | 1,160 | 1,306 | 1,369 | 1,188 | 1,219 | 1,050 | 1,163 | 1,012 | 1,037 | 1,167 | 1,044 | 974 |
| 2001 | 1,192 | 1,151 | 841 | 851 | 986 | 1,079 | 1,023 | 1,004 | 862 | 945 | 1,036 | 1,165 |
| 2002 | 1,230 | 1,108 | 1,008 | 1,080 | 1,166 | 1,165 | 1,031 | 900 | 1,076 | 849 | 1,142 | 1,317 |
| 2003 | 1,312 | 1,193 | 1,125 | 1,059 | 1,112 | 1,145 | 1,052 | 956 | 829 | 853 | 994 | 1,115 |
| 2004 | 1,173 | 1,243 | 1,199 | 1,049 | 1,042 | 1,101 | 1,079 | 1,190 | 988 | 886 | 944 | 1,102 |
| 2005 | 1,389 | 1,253 | 1,092 | 1,134 | 1,178 | 1,066 | 1,097 | 833 | 1,160 | 1,070 | 1,510 | 1,326 |
| 2006 | 1,396 | 1,499 | 1,086 | 1,210 | 1,012 | 867 | 818 | 914 | 730 | 840 | 1,270 | 1,451 |
| 2007 | 1,284 | 1,202 | 765 | 546 | 648 | 718 | 716 | 768 | 753 | 663 | 956 | 1,131 |
| 2008 | 1,490 | 1,378 | 1,278 | 1,232 | 1,163 | 1,212 | 973 | 896 | 1,016 | 859 | 962 | 1,090 |
| 2009 | 1,602 | 1,859 | 1,483 | 1,772 | 1,090 | 1,330 | 1,358 | 1,541 | 1,509 | 1,674 | 1,588 | 1,555 |
| 2010 | 2,041 | 1,816 | 2,002 | 1,458 | 1,508 | 1,179 | 1,113 | 1,171 | 1,291 | 1,462 | 1,490 | 1,531 |
| 2011 | 1,606 | 1,635 | 1,765 | 1,328 | 978 | 1,424 | 1,009 | 932 | 1,199 | 1,173 | 1,592 | 1,678 |
| 2012 | 1,860 | 1,770 | 1,450 | 1,281 | 1,093 | 939 | 1,115 | 1,086 | 930 | 1,104 | 1,355 | 1,773 |
| 2013 | 1,869 | 1,785 | 1,602 | 1,168 | 941 | 1,074 | 1,194 | 1,098 | 453 | 408 | 274 | 300 |
| 2014 | 351 | 378 | 251 | 261 | 260 | 233 | 227 | 181 | 195 | 182 | 153 | 289 |
| 2015 | 255 | 284 | 271 | 211 | 124 | 141 | 133 | 126 | 99 | 101 | 209 | 233 |
| 2016 | 253 | 213 | 146 | 126 | 132 | 163 | 157 | 80 | 153 | 144 | 177 | 153 |
| 2017 | 221 | 200 | 188 | 139 | 175 | 148 | 140 | 141 | 130 | 153 | 180 | 183 |
| 2018 | 201 | 190 | 187 | 187 | 182 | 248 | 193 | 172 | 167 | 165 | 148 | 183 |
| 2019 | 219 | 230 | 255 | 164 | 164 | 150 | 206 | 225 | 148 | 209 | 162 | 243 |
| 2020 | 223 | 203 | 223 | 194 | 275 | 237 | 217 | 196 | 184 | 255 | 284 | 254 |
| 2021 | 57 | 48 | 43 | 50 | 48 | 50 | 45 | 44 | 46 | 39 | 49 | 44 |
| 2022 | 45 | 58 | 43 | 54 | 49 | 50 | 35 | 39 | 28 | 42 | 39 | 53 |
| 2023 | 39 | 44 | 27 | 28 | 25 | 40 | 19 | 40 | 22 | 26 | 37 | 35 |
| 2024 | 32 | |||||||||||
| - = No Data Reported; -- = Not Applicable; NA = Not Available; W = Withheld to avoid disclosure of individual company data. |
| Release Date: 3/29/2024 |
| Next Release Date: 4/30/2024 |