|
Download Data (XLS File) |
|
||||||||
|
||||||||
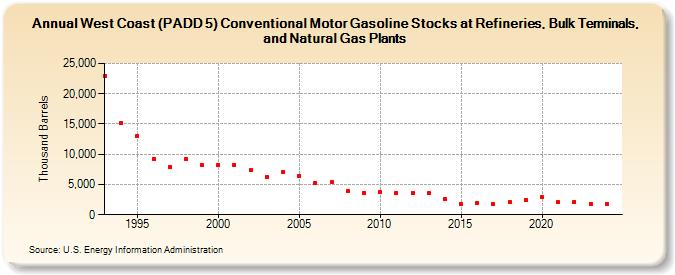
| West Coast (PADD 5) Conventional Motor Gasoline Stocks at Refineries, Bulk Terminals, and Natural Gas Plants (Thousand Barrels) | ||||||||
| Decade | Year-0 | Year-1 | Year-2 | Year-3 | Year-4 | Year-5 | Year-6 | Year-7 | Year-8 | Year-9 |
|---|---|---|---|---|---|---|---|---|---|---|
| 1990's | 23,002 | 15,148 | 13,036 | 9,285 | 7,966 | 9,130 | 8,217 | |||
| 2000's | 8,220 | 8,275 | 7,328 | 6,259 | 7,046 | 6,465 | 5,172 | 5,328 | 3,846 | 3,645 |
| 2010's | 3,707 | 3,623 | 3,568 | 3,519 | 2,570 | 1,833 | 2,015 | 1,748 | 2,028 | 2,500 |
| 2020's | 2,859 | 2,058 | 2,171 | 1,730 |
| - = No Data Reported; -- = Not Applicable; NA = Not Available; W = Withheld to avoid disclosure of individual company data. |
| Release Date: 3/29/2024 |
| Next Release Date: 8/30/2024 |