|
Download Data (XLS File) |
|
||||||||
|
||||||||
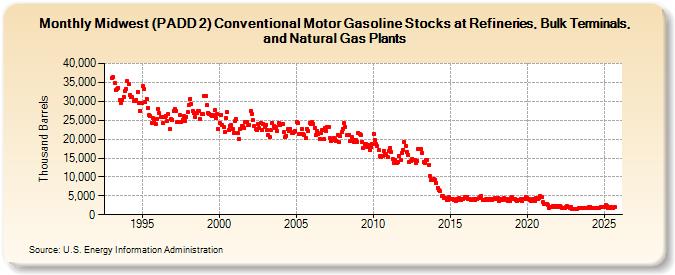
| Midwest (PADD 2) Conventional Motor Gasoline Stocks at Refineries, Bulk Terminals, and Natural Gas Plants (Thousand Barrels) | ||||||||
| Year | Jan | Feb | Mar | Apr | May | Jun | Jul | Aug | Sep | Oct | Nov | Dec |
|---|---|---|---|---|---|---|---|---|---|---|---|---|
| 1993 | 36,152 | 36,345 | 34,745 | 33,023 | 33,169 | 33,588 | 30,279 | 29,424 | 30,324 | 31,221 | 32,722 | 33,350 |
| 1994 | 35,329 | 34,492 | 31,552 | 31,182 | 31,114 | 29,989 | 30,132 | 30,398 | 32,545 | 29,421 | 27,527 | 29,664 |
| 1995 | 33,992 | 33,194 | 29,772 | 30,661 | 28,318 | 26,264 | 26,103 | 24,384 | 25,523 | 24,754 | 23,922 | 25,339 |
| 1996 | 28,026 | 26,801 | 25,934 | 25,845 | 24,260 | 25,723 | 26,221 | 24,772 | 26,579 | 22,548 | 25,382 | 25,172 |
| 1997 | 27,384 | 28,088 | 27,472 | 24,527 | 24,639 | 26,268 | 24,589 | 25,052 | 26,014 | 24,681 | 25,783 | 27,157 |
| 1998 | 29,025 | 30,696 | 29,204 | 27,506 | 26,804 | 25,719 | 26,781 | 27,512 | 27,361 | 25,185 | 26,744 | 26,640 |
| 1999 | 31,278 | 31,375 | 28,895 | 26,930 | 26,741 | 26,485 | 26,155 | 26,281 | 27,689 | 25,500 | 26,568 | 22,677 |
| 2000 | 24,372 | 26,494 | 23,752 | 23,328 | 21,946 | 25,560 | 27,098 | 22,413 | 23,565 | 23,720 | 22,646 | 21,715 |
| 2001 | 24,675 | 25,205 | 21,567 | 20,066 | 22,751 | 23,536 | 23,395 | 22,995 | 24,582 | 24,425 | 23,732 | 23,796 |
| 2002 | 27,554 | 26,582 | 24,922 | 23,397 | 22,556 | 22,313 | 23,890 | 22,855 | 24,329 | 22,358 | 24,090 | 23,185 |
| 2003 | 23,750 | 22,538 | 21,097 | 20,484 | 22,519 | 24,197 | 23,445 | 23,000 | 23,156 | 22,196 | 24,317 | 23,779 |
| 2004 | 23,925 | 24,062 | 21,755 | 20,550 | 20,945 | 22,624 | 22,129 | 22,675 | 21,732 | 21,508 | 21,941 | 22,269 |
| 2005 | 24,637 | 24,203 | 21,310 | 21,375 | 22,776 | 21,471 | 21,024 | 20,255 | 22,688 | 22,146 | 24,297 | 23,995 |
| 2006 | 24,393 | 24,023 | 23,036 | 21,141 | 22,185 | 21,244 | 20,124 | 21,563 | 22,332 | 19,954 | 22,840 | 22,184 |
| 2007 | 23,164 | 23,303 | 20,220 | 19,424 | 19,855 | 20,411 | 19,895 | 19,569 | 21,130 | 19,337 | 20,871 | 21,858 |
| 2008 | 22,724 | 24,162 | 23,235 | 20,963 | 21,171 | 21,210 | 19,607 | 20,424 | 19,774 | 19,141 | 19,801 | 19,282 |
| 2009 | 21,706 | 21,415 | 20,953 | 19,347 | 17,609 | 18,670 | 18,728 | 17,789 | 18,473 | 17,106 | 17,864 | 18,709 |
| 2010 | 21,444 | 19,781 | 18,763 | 18,043 | 16,991 | 15,579 | 15,326 | 15,436 | 16,971 | 16,158 | 15,737 | 15,162 |
| 2011 | 16,834 | 17,737 | 16,632 | 14,699 | 13,777 | 14,429 | 13,723 | 13,814 | 15,554 | 14,453 | 16,455 | 17,199 |
| 2012 | 19,284 | 18,298 | 16,663 | 15,744 | 14,001 | 14,107 | 14,772 | 14,510 | 14,434 | 13,613 | 14,240 | 17,372 |
| 2013 | 17,252 | 17,305 | 16,422 | 13,975 | 13,763 | 14,526 | 14,348 | 13,209 | 10,172 | 9,129 | 9,207 | 9,370 |
| 2014 | 9,186 | 8,324 | 7,159 | 6,448 | 6,147 | 4,907 | 4,950 | 4,525 | 4,415 | 3,802 | 3,854 | 4,777 |
| 2015 | 4,276 | 4,217 | 4,149 | 3,969 | 3,696 | 4,226 | 4,022 | 4,365 | 3,891 | 4,035 | 4,106 | 4,807 |
| 2016 | 4,519 | 4,730 | 4,235 | 4,155 | 4,015 | 4,011 | 4,204 | 3,863 | 4,201 | 4,144 | 4,372 | 4,692 |
| 2017 | 4,958 | 3,884 | 3,843 | 3,900 | 4,193 | 3,781 | 4,244 | 4,202 | 3,776 | 4,179 | 4,287 | 4,342 |
| 2018 | 4,273 | 4,347 | 3,712 | 4,038 | 3,937 | 4,058 | 4,378 | 3,998 | 4,113 | 3,595 | 3,752 | 4,294 |
| 2019 | 4,630 | 4,187 | 4,140 | 3,962 | 3,621 | 3,809 | 3,861 | 4,221 | 3,718 | 4,199 | 4,067 | 4,584 |
| 2020 | 4,507 | 4,245 | 4,007 | 3,611 | 4,033 | 4,106 | 3,727 | 4,317 | 4,227 | 4,411 | 4,857 | 4,730 |
| 2021 | 3,260 | 2,839 | 2,959 | 2,917 | 2,617 | 1,855 | 2,054 | 1,957 | 2,254 | 2,150 | 2,185 | 2,081 |
| 2022 | 2,229 | 2,177 | 1,955 | 1,899 | 1,668 | 1,829 | 1,926 | 2,177 | 1,909 | 1,809 | 1,979 | 1,498 |
| 2023 | 1,641 | 1,546 | 1,571 | 1,513 | 1,808 | 1,801 | 1,812 | 1,837 | 1,818 | 1,843 | 1,889 | 1,854 |
| 2024 | 2,071 | |||||||||||
| - = No Data Reported; -- = Not Applicable; NA = Not Available; W = Withheld to avoid disclosure of individual company data. |
| Release Date: 3/29/2024 |
| Next Release Date: 4/30/2024 |