|
Download Data (XLS File) |
|
||||||||
|
||||||||
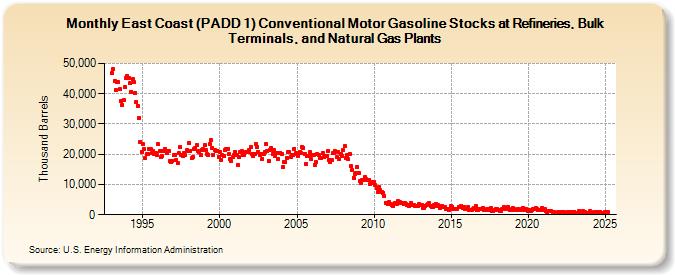
| East Coast (PADD 1) Conventional Motor Gasoline Stocks at Refineries, Bulk Terminals, and Natural Gas Plants (Thousand Barrels) | ||||||||
| Year | Jan | Feb | Mar | Apr | May | Jun | Jul | Aug | Sep | Oct | Nov | Dec |
|---|---|---|---|---|---|---|---|---|---|---|---|---|
| 1993 | 46,852 | 48,041 | 44,236 | 41,226 | 43,890 | 43,805 | 41,472 | 37,515 | 36,333 | 37,892 | 42,168 | 45,292 |
| 1994 | 45,868 | 45,037 | 43,450 | 40,699 | 44,862 | 43,783 | 40,359 | 37,190 | 36,098 | 31,856 | 23,967 | 20,874 |
| 1995 | 23,266 | 21,722 | 18,751 | 20,050 | 20,163 | 21,860 | 21,734 | 20,285 | 21,037 | 20,168 | 20,443 | 19,707 |
| 1996 | 23,246 | 20,942 | 18,966 | 19,399 | 21,120 | 21,574 | 21,109 | 20,284 | 21,105 | 17,667 | 17,427 | 17,864 |
| 1997 | 19,594 | 19,863 | 18,239 | 16,956 | 20,240 | 22,418 | 19,897 | 19,418 | 20,311 | 19,674 | 21,298 | 21,088 |
| 1998 | 23,649 | 21,202 | 18,651 | 18,977 | 21,671 | 22,203 | 23,085 | 21,131 | 20,816 | 19,635 | 21,432 | 21,652 |
| 1999 | 22,983 | 21,242 | 20,074 | 19,897 | 23,339 | 24,586 | 22,203 | 19,832 | 21,473 | 20,902 | 21,179 | 19,238 |
| 2000 | 20,761 | 18,226 | 19,624 | 19,255 | 21,355 | 21,716 | 21,867 | 20,079 | 18,379 | 17,689 | 19,102 | 19,633 |
| 2001 | 20,848 | 19,771 | 16,555 | 19,001 | 20,846 | 20,943 | 19,660 | 19,623 | 20,653 | 20,812 | 20,631 | 21,306 |
| 2002 | 22,310 | 20,166 | 19,419 | 20,108 | 23,287 | 22,540 | 20,879 | 19,664 | 20,210 | 18,459 | 19,992 | 20,630 |
| 2003 | 23,329 | 20,948 | 17,894 | 21,496 | 22,074 | 20,112 | 21,242 | 19,383 | 20,276 | 18,484 | 20,249 | 20,439 |
| 2004 | 20,149 | 15,780 | 17,588 | 17,357 | 18,876 | 20,576 | 20,660 | 19,154 | 19,794 | 19,899 | 21,844 | 20,339 |
| 2005 | 20,159 | 19,483 | 20,762 | 20,337 | 22,350 | 22,108 | 20,175 | 16,915 | 19,285 | 19,574 | 20,725 | 18,298 |
| 2006 | 19,879 | 19,617 | 16,567 | 17,325 | 20,050 | 19,687 | 18,847 | 18,653 | 20,421 | 19,131 | 19,370 | 19,336 |
| 2007 | 20,951 | 18,111 | 17,360 | 18,047 | 20,291 | 20,490 | 20,945 | 18,930 | 20,851 | 18,392 | 19,978 | 19,546 |
| 2008 | 21,367 | 22,624 | 18,830 | 19,731 | 18,299 | 20,127 | 15,997 | 14,755 | 12,287 | 13,542 | 13,798 | 15,828 |
| 2009 | 13,783 | 11,024 | 10,634 | 11,485 | 11,504 | 12,441 | 11,746 | 11,566 | 11,637 | 10,010 | 10,839 | 10,612 |
| 2010 | 10,856 | 9,965 | 8,844 | 7,461 | 9,002 | 8,065 | 7,549 | 7,313 | 6,240 | 3,960 | 4,019 | 3,672 |
| 2011 | 4,193 | 3,706 | 3,089 | 2,822 | 3,714 | 3,885 | 3,638 | 4,392 | 4,233 | 4,006 | 3,712 | 3,577 |
| 2012 | 3,987 | 3,499 | 3,148 | 2,765 | 3,106 | 3,956 | 3,346 | 3,095 | 2,827 | 2,826 | 2,759 | 3,485 |
| 2013 | 3,291 | 3,100 | 2,128 | 2,265 | 2,919 | 3,278 | 3,706 | 3,740 | 2,810 | 2,575 | 2,664 | 3,159 |
| 2014 | 3,477 | 2,821 | 3,047 | 2,330 | 3,011 | 2,958 | 2,624 | 2,590 | 1,915 | 1,736 | 1,598 | 1,759 |
| 2015 | 2,951 | 2,552 | 1,881 | 1,975 | 2,020 | 2,051 | 2,558 | 2,550 | 2,974 | 2,360 | 2,405 | 1,885 |
| 2016 | 2,213 | 2,511 | 1,522 | 1,552 | 1,557 | 1,938 | 2,068 | 2,766 | 1,572 | 1,420 | 1,815 | 1,812 |
| 2017 | 1,829 | 2,176 | 1,476 | 1,545 | 1,741 | 1,768 | 1,565 | 2,209 | 1,353 | 1,361 | 1,662 | 2,045 |
| 2018 | 1,934 | 1,414 | 1,385 | 1,350 | 1,985 | 2,522 | 2,042 | 2,224 | 2,624 | 1,801 | 1,424 | 1,497 |
| 2019 | 2,156 | 1,848 | 1,518 | 1,406 | 1,991 | 1,634 | 1,686 | 1,978 | 2,206 | 1,655 | 1,926 | 1,528 |
| 2020 | 1,358 | 1,499 | 1,141 | 1,419 | 1,862 | 2,017 | 2,073 | 1,845 | 1,486 | 1,537 | 1,459 | 2,362 |
| 2021 | 1,614 | 1,750 | 1,087 | 1,056 | 1,284 | 1,068 | 1,091 | 856 | 876 | 651 | 691 | 752 |
| 2022 | 780 | 715 | 950 | 798 | 858 | 664 | 639 | 806 | 958 | 947 | 641 | 540 |
| 2023 | 981 | 727 | 479 | 724 | 1,149 | 794 | 726 | 1,076 | 967 | 624 | 726 | 731 |
| 2024 | 1,089 | |||||||||||
| - = No Data Reported; -- = Not Applicable; NA = Not Available; W = Withheld to avoid disclosure of individual company data. |
| Release Date: 3/29/2024 |
| Next Release Date: 4/30/2024 |