|
Download Data (XLS File) |
|
||||||||
|
||||||||
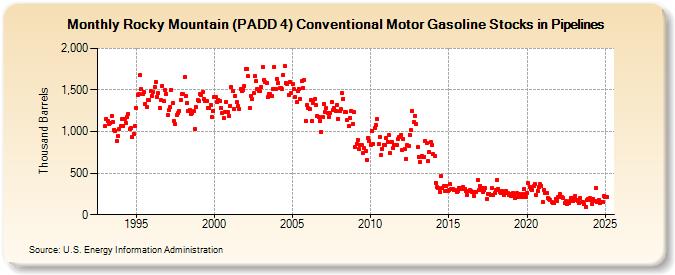
| Rocky Mountain (PADD 4) Conventional Motor Gasoline Stocks in Pipelines (Thousand Barrels) | ||||||||
| Year | Jan | Feb | Mar | Apr | May | Jun | Jul | Aug | Sep | Oct | Nov | Dec |
|---|---|---|---|---|---|---|---|---|---|---|---|---|
| 1993 | 1,065 | 1,151 | 1,132 | 1,094 | 1,102 | 1,193 | 1,116 | 1,022 | 1,011 | 887 | 942 | 1,032 |
| 1994 | 1,063 | 1,147 | 1,064 | 1,153 | 1,105 | 1,180 | 1,217 | 1,026 | 1,046 | 932 | 969 | 1,064 |
| 1995 | 1,288 | 1,445 | 1,446 | 1,680 | 1,507 | 1,452 | 1,475 | 1,336 | 1,293 | 1,385 | 1,379 | 1,487 |
| 1996 | 1,433 | 1,481 | 1,539 | 1,598 | 1,420 | 1,458 | 1,288 | 1,378 | 1,552 | 1,367 | 1,494 | 1,449 |
| 1997 | 1,194 | 1,259 | 1,291 | 1,505 | 1,340 | 1,123 | 1,085 | 1,201 | 1,220 | 1,252 | 1,377 | 1,448 |
| 1998 | 1,447 | 1,652 | 1,430 | 1,349 | 1,253 | 1,256 | 1,208 | 1,221 | 1,243 | 1,027 | 1,294 | 1,376 |
| 1999 | 1,366 | 1,455 | 1,434 | 1,474 | 1,391 | 1,372 | 1,362 | 1,285 | 1,283 | 1,322 | 1,177 | 1,251 |
| 2000 | 1,417 | 1,411 | 1,355 | 1,383 | 1,371 | 1,278 | 1,225 | 1,159 | 1,240 | 1,361 | 1,232 | 1,192 |
| 2001 | 1,308 | 1,535 | 1,490 | 1,271 | 1,428 | 1,352 | 1,304 | 1,266 | 1,508 | 1,485 | 1,503 | 1,545 |
| 2002 | 1,748 | 1,753 | 1,664 | 1,287 | 1,428 | 1,387 | 1,461 | 1,666 | 1,606 | 1,511 | 1,484 | 1,484 |
| 2003 | 1,538 | 1,776 | 1,621 | 1,590 | 1,581 | 1,411 | 1,456 | 1,446 | 1,432 | 1,508 | 1,780 | 1,509 |
| 2004 | 1,634 | 1,582 | 1,519 | 1,529 | 1,508 | 1,682 | 1,785 | 1,580 | 1,577 | 1,443 | 1,599 | 1,469 |
| 2005 | 1,574 | 1,506 | 1,417 | 1,350 | 1,490 | 1,517 | 1,397 | 1,604 | 1,525 | 1,615 | 1,129 | 1,321 |
| 2006 | 1,279 | 1,269 | 1,375 | 1,122 | 1,348 | 1,387 | 1,314 | 1,187 | 1,178 | 1,127 | 996 | 1,175 |
| 2007 | 1,337 | 1,235 | 1,280 | 1,223 | 1,177 | 1,219 | 1,358 | 1,257 | 1,281 | 1,253 | 1,324 | 1,154 |
| 2008 | 1,244 | 1,271 | 1,463 | 1,393 | 1,231 | 1,230 | 1,139 | 1,069 | 1,168 | 1,251 | 1,096 | 1,231 |
| 2009 | 813 | 850 | 900 | 788 | 840 | 838 | 743 | 801 | 772 | 662 | 927 | 888 |
| 2010 | 843 | 1,001 | 854 | 1,041 | 1,075 | 1,152 | 855 | 940 | 724 | 795 | 839 | 840 |
| 2011 | 928 | 879 | 953 | 742 | 878 | 798 | 837 | 840 | 836 | 912 | 940 | 955 |
| 2012 | 782 | 911 | 793 | 670 | 841 | 828 | 963 | 1,014 | 1,245 | 1,113 | 1,189 | 1,085 |
| 2013 | 814 | 700 | 639 | 702 | 688 | 693 | 891 | 862 | 641 | 753 | 871 | 836 |
| 2014 | 730 | 711 | 385 | 329 | 319 | 276 | 462 | 326 | 344 | 287 | 349 | 289 |
| 2015 | 296 | 364 | 307 | 309 | 300 | 293 | 268 | 284 | 325 | 320 | 315 | 334 |
| 2016 | 313 | 280 | 242 | 288 | 294 | 287 | 271 | 231 | 276 | 272 | 419 | 297 |
| 2017 | 349 | 326 | 279 | 294 | 316 | 194 | 253 | 254 | 232 | 324 | 232 | 256 |
| 2018 | 300 | 420 | 310 | 273 | 258 | 285 | 235 | 263 | 288 | 262 | 242 | 250 |
| 2019 | 220 | 264 | 229 | 198 | 256 | 212 | 254 | 220 | 213 | 251 | 307 | 214 |
| 2020 | 265 | 377 | 337 | 307 | 296 | 341 | 373 | 239 | 289 | 332 | 365 | 349 |
| 2021 | 151 | 303 | 266 | 257 | 200 | 183 | 176 | 147 | 146 | 137 | 192 | 169 |
| 2022 | 211 | 247 | 208 | 212 | 198 | 142 | 159 | 132 | 137 | 163 | 206 | 159 |
| 2023 | 204 | 227 | 178 | 161 | 143 | 200 | 147 | 152 | 129 | 95 | 175 | 192 |
| 2024 | 195 | |||||||||||
| - = No Data Reported; -- = Not Applicable; NA = Not Available; W = Withheld to avoid disclosure of individual company data. |
| Release Date: 3/29/2024 |
| Next Release Date: 4/30/2024 |