|
Download Data (XLS File) |
|
||||||||
|
||||||||
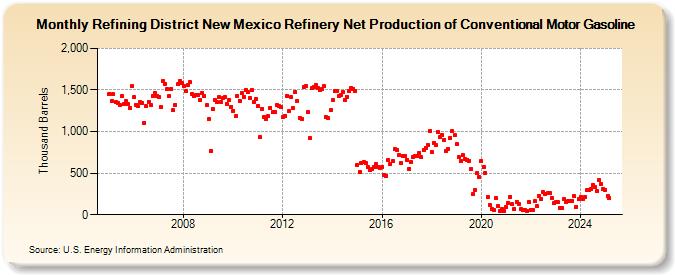
| Refining District New Mexico Refinery Net Production of Conventional Motor Gasoline (Thousand Barrels) | ||||||||
| Year | Jan | Feb | Mar | Apr | May | Jun | Jul | Aug | Sep | Oct | Nov | Dec |
|---|---|---|---|---|---|---|---|---|---|---|---|---|
| 2005 | 1,455 | 1,369 | 1,447 | 1,352 | 1,344 | 1,323 | 1,427 | 1,331 | 1,362 | 1,336 | 1,284 | 1,543 |
| 2006 | 1,411 | 1,325 | 1,303 | 1,351 | 1,342 | 1,107 | 1,303 | 1,359 | 1,316 | 1,422 | 1,466 | 1,428 |
| 2007 | 1,420 | 1,293 | 1,606 | 1,572 | 1,510 | 1,422 | 1,516 | 1,254 | 1,324 | 1,566 | 1,609 | 1,579 |
| 2008 | 1,545 | 1,484 | 1,562 | 1,590 | 1,449 | 1,426 | 1,445 | 1,440 | 1,380 | 1,469 | 1,425 | 1,316 |
| 2009 | 1,148 | 769 | 1,272 | 1,384 | 1,354 | 1,412 | 1,356 | 1,406 | 1,410 | 1,327 | 1,378 | 1,300 |
| 2010 | 1,251 | 1,182 | 1,425 | 1,373 | 1,460 | 1,419 | 1,500 | 1,480 | 1,400 | 1,498 | 1,359 | 1,386 |
| 2011 | 1,313 | 933 | 1,277 | 1,172 | 1,151 | 1,188 | 1,287 | 1,230 | 1,236 | 1,315 | 1,307 | 1,296 |
| 2012 | 1,174 | 1,191 | 1,431 | 1,243 | 1,413 | 1,281 | 1,474 | 1,366 | 1,167 | 1,154 | 1,530 | 1,545 |
| 2013 | 1,233 | 920 | 1,520 | 1,533 | 1,555 | 1,526 | 1,502 | 1,513 | 1,544 | 1,171 | 1,159 | 1,256 |
| 2014 | 1,376 | 1,485 | 1,488 | 1,426 | 1,445 | 1,474 | 1,385 | 1,421 | 1,485 | 1,528 | 1,516 | 1,490 |
| 2015 | 599 | 514 | 622 | 629 | 621 | 572 | 542 | 549 | 572 | 608 | 574 | 564 |
| 2016 | 571 | 478 | 471 | 654 | 609 | 645 | 786 | 777 | 717 | 622 | 706 | 707 |
| 2017 | 661 | 553 | 629 | 690 | 710 | 702 | 746 | 689 | 778 | 806 | 837 | 1,004 |
| 2018 | 754 | 864 | 834 | 992 | 932 | 961 | 903 | 772 | 792 | 928 | 1,004 | 955 |
| 2019 | 849 | 692 | 646 | 715 | 664 | 662 | 651 | 550 | 248 | 293 | 501 | 454 |
| 2020 | 643 | 575 | 502 | 218 | 118 | 74 | 59 | 198 | 99 | 40 | 71 | 47 |
| 2021 | 90 | 145 | 215 | 123 | 71 | 155 | 130 | 68 | 62 | 57 | 47 | 155 |
| 2022 | 57 | 55 | 160 | 100 | 231 | 184 | 270 | 251 | 259 | 257 | 206 | 140 |
| 2023 | 151 | 149 | 84 | 78 | 188 | 151 | 163 | 168 | 165 | 220 | 98 | 184 |
| 2024 | 214 | |||||||||||
| - = No Data Reported; -- = Not Applicable; NA = Not Available; W = Withheld to avoid disclosure of individual company data. |
| Release Date: 3/29/2024 |
| Next Release Date: 4/30/2024 |