|
Download Data (XLS File) |
|
||||||||
|
||||||||
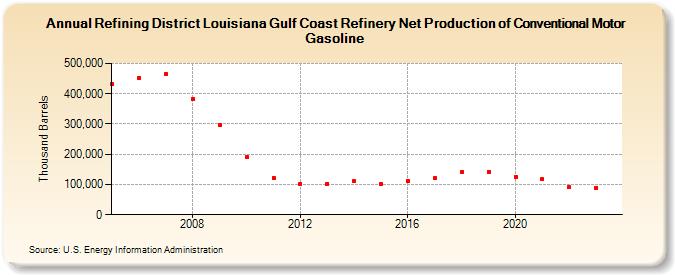
| Refining District Louisiana Gulf Coast Refinery Net Production of Conventional Motor Gasoline (Thousand Barrels) | ||||||||
| Decade | Year-0 | Year-1 | Year-2 | Year-3 | Year-4 | Year-5 | Year-6 | Year-7 | Year-8 | Year-9 |
|---|---|---|---|---|---|---|---|---|---|---|
| 2000's | 430,533 | 452,952 | 466,827 | 381,931 | 296,298 | |||||
| 2010's | 190,699 | 122,855 | 101,282 | 103,193 | 110,121 | 101,830 | 110,433 | 120,172 | 142,506 | 142,776 |
| 2020's | 126,289 | 117,872 | 90,560 | 89,359 |
| - = No Data Reported; -- = Not Applicable; NA = Not Available; W = Withheld to avoid disclosure of individual company data. |
| Release Date: 8/30/2024 |
| Next Release Date: 8/29/2025 |