|
Download Data (XLS File) |
|
||||||||
|
||||||||
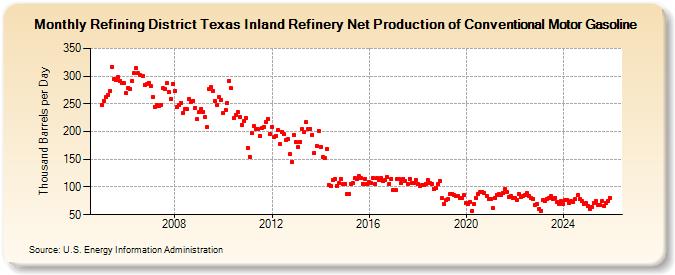
| Refining District Texas Inland Refinery Net Production of Conventional Motor Gasoline (Thousand Barrels per Day) | ||||||||
| Year | Jan | Feb | Mar | Apr | May | Jun | Jul | Aug | Sep | Oct | Nov | Dec |
|---|---|---|---|---|---|---|---|---|---|---|---|---|
| 2005 | 248 | 256 | 262 | 266 | 274 | 317 | 295 | 293 | 298 | 292 | 287 | 287 |
| 2006 | 269 | 279 | 277 | 291 | 305 | 314 | 305 | 302 | 300 | 284 | 285 | 288 |
| 2007 | 282 | 263 | 245 | 248 | 246 | 248 | 278 | 276 | 287 | 272 | 258 | 286 |
| 2008 | 273 | 244 | 248 | 252 | 234 | 241 | 240 | 259 | 253 | 256 | 243 | 222 |
| 2009 | 235 | 241 | 235 | 226 | 208 | 277 | 280 | 274 | 255 | 248 | 262 | 257 |
| 2010 | 233 | 239 | 251 | 291 | 278 | 224 | 230 | 235 | 226 | 212 | 219 | 224 |
| 2011 | 171 | 155 | 197 | 210 | 205 | 204 | 192 | 206 | 209 | 218 | 223 | 195 |
| 2012 | 209 | 191 | 192 | 202 | 177 | 200 | 195 | 185 | 186 | 159 | 145 | 194 |
| 2013 | 181 | 172 | 182 | 204 | 199 | 217 | 205 | 205 | 194 | 162 | 174 | 201 |
| 2014 | 173 | 154 | 152 | 168 | 104 | 102 | 113 | 114 | 102 | 107 | 115 | 105 |
| 2015 | 106 | 88 | 87 | 106 | 107 | 116 | 114 | 119 | 116 | 106 | 115 | 105 |
| 2016 | 109 | 107 | 116 | 106 | 116 | 112 | 116 | 110 | 112 | 118 | 106 | 115 |
| 2017 | 95 | 94 | 114 | 114 | 107 | 115 | 110 | 105 | 115 | 107 | 107 | 113 |
| 2018 | 105 | 101 | 103 | 104 | 106 | 113 | 107 | 106 | 97 | 99 | 105 | 110 |
| 2019 | 80 | 69 | 76 | 79 | 87 | 88 | 86 | 83 | 83 | 81 | 80 | 86 |
| 2020 | 72 | 69 | 73 | 57 | 69 | 80 | 87 | 91 | 91 | 89 | 83 | 78 |
| 2021 | 78 | 62 | 81 | 86 | 87 | 86 | 90 | 96 | 91 | 82 | 83 | 81 |
| 2022 | 80 | 77 | 88 | 82 | 83 | 85 | 90 | 84 | 80 | 79 | 68 | 70 |
| 2023 | 61 | 57 | 76 | 75 | 79 | 81 | 83 | 79 | 81 | 73 | 70 | 74 |
| 2024 | 69 | |||||||||||
| - = No Data Reported; -- = Not Applicable; NA = Not Available; W = Withheld to avoid disclosure of individual company data. |
| Release Date: 3/29/2024 |
| Next Release Date: 4/30/2024 |