|
Download Data (XLS File) |
|
||||||||
|
||||||||
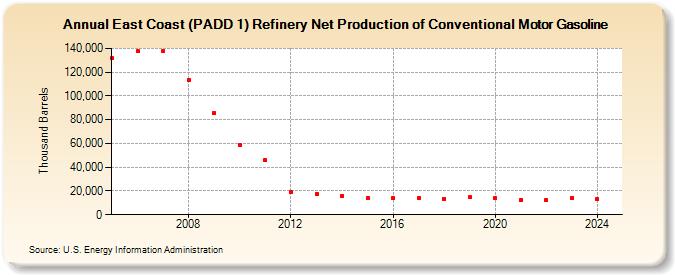
| East Coast (PADD 1) Refinery Net Production of Conventional Motor Gasoline (Thousand Barrels) | ||||||||
| Decade | Year-0 | Year-1 | Year-2 | Year-3 | Year-4 | Year-5 | Year-6 | Year-7 | Year-8 | Year-9 |
|---|---|---|---|---|---|---|---|---|---|---|
| 2000's | 131,563 | 137,963 | 137,876 | 113,562 | 85,646 | |||||
| 2010's | 58,378 | 45,830 | 18,887 | 17,458 | 16,000 | 13,941 | 14,153 | 13,823 | 13,532 | 14,548 |
| 2020's | 13,967 | 12,699 | 12,246 | 14,201 |
| - = No Data Reported; -- = Not Applicable; NA = Not Available; W = Withheld to avoid disclosure of individual company data. |
| Release Date: 8/30/2024 |
| Next Release Date: 8/29/2025 |