|
Download Data (XLS File) |
|
||||||||
|
||||||||
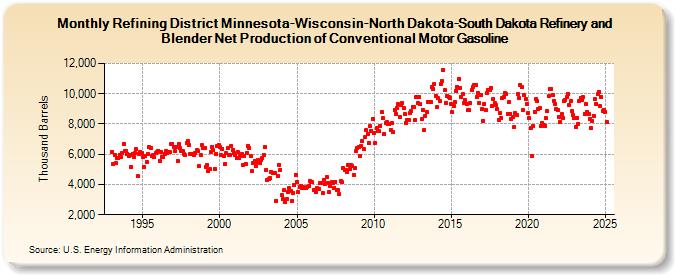
| Refining District Minnesota-Wisconsin-North Dakota-South Dakota Refinery and Blender Net Production of Conventional Motor Gasoline (Thousand Barrels) | ||||||||
| Year | Jan | Feb | Mar | Apr | May | Jun | Jul | Aug | Sep | Oct | Nov | Dec |
|---|---|---|---|---|---|---|---|---|---|---|---|---|
| 1993 | 6,149 | 5,348 | 5,950 | 5,427 | 5,726 | 5,734 | 5,953 | 5,798 | 6,061 | 6,682 | 6,219 | 6,221 |
| 1994 | 6,042 | 5,862 | 5,972 | 5,141 | 6,045 | 5,821 | 6,083 | 6,319 | 4,555 | 6,045 | 6,157 | 6,088 |
| 1995 | 5,839 | 5,176 | 5,898 | 5,513 | 6,041 | 6,498 | 6,406 | 5,866 | 5,919 | 5,792 | 6,049 | 6,132 |
| 1996 | 6,240 | 5,553 | 6,170 | 5,833 | 5,800 | 6,046 | 6,189 | 6,063 | 6,160 | 6,140 | 6,673 | 6,704 |
| 1997 | 6,491 | 6,202 | 6,491 | 5,559 | 6,694 | 6,405 | 6,195 | 6,183 | 6,006 | 5,934 | 6,716 | 6,844 |
| 1998 | 6,596 | 5,998 | 5,991 | 5,983 | 5,955 | 6,053 | 6,284 | 6,192 | 5,225 | 5,945 | 6,589 | 6,417 |
| 1999 | 6,407 | 5,183 | 5,290 | 4,888 | 4,991 | 6,144 | 6,479 | 6,252 | 5,038 | 6,042 | 6,542 | 6,619 |
| 2000 | 6,445 | 5,957 | 6,374 | 5,861 | 5,352 | 6,050 | 6,389 | 5,962 | 5,963 | 6,559 | 6,265 | 6,069 |
| 2001 | 5,955 | 5,748 | 6,146 | 5,739 | 5,873 | 6,016 | 5,282 | 5,890 | 5,361 | 6,080 | 6,550 | 6,434 |
| 2002 | 5,862 | 4,867 | 5,411 | 5,547 | 5,231 | 5,492 | 5,605 | 5,452 | 5,604 | 5,736 | 5,981 | 6,470 |
| 2003 | 4,963 | 4,311 | 4,345 | 4,431 | 4,797 | 4,769 | 4,783 | 4,785 | 2,935 | 4,567 | 5,282 | 4,978 |
| 2004 | 3,297 | 3,025 | 3,603 | 2,856 | 3,016 | 3,522 | 3,775 | 3,577 | 2,914 | 3,442 | 3,965 | 4,655 |
| 2005 | 4,182 | 3,518 | 3,849 | 3,900 | 3,758 | 3,815 | 3,744 | 3,738 | 3,805 | 3,889 | 4,207 | 4,168 |
| 2006 | 4,139 | 3,640 | 3,617 | 3,525 | 3,767 | 3,720 | 4,102 | 4,071 | 3,426 | 4,299 | 4,015 | 4,491 |
| 2007 | 4,122 | 3,488 | 3,915 | 4,133 | 4,065 | 3,771 | 4,190 | 3,606 | 3,605 | 3,353 | 4,229 | 4,143 |
| 2008 | 5,093 | 4,935 | 4,964 | 4,813 | 5,277 | 5,000 | 5,266 | 5,208 | 4,644 | 5,058 | 6,183 | 6,386 |
| 2009 | 6,480 | 5,886 | 6,546 | 6,862 | 6,318 | 7,119 | 7,570 | 7,323 | 6,743 | 7,846 | 7,552 | 8,326 |
| 2010 | 7,421 | 6,773 | 7,711 | 7,555 | 7,503 | 7,886 | 8,771 | 8,392 | 7,332 | 8,080 | 8,143 | 7,976 |
| 2011 | 7,976 | 7,591 | 8,043 | 7,445 | 8,931 | 8,682 | 9,089 | 9,313 | 8,459 | 9,279 | 9,379 | 9,077 |
| 2012 | 8,630 | 8,073 | 8,260 | 8,237 | 8,719 | 8,856 | 9,146 | 9,139 | 8,237 | 9,804 | 9,377 | 9,803 |
| 2013 | 9,333 | 8,325 | 8,944 | 7,616 | 8,548 | 8,809 | 9,477 | 9,470 | 9,485 | 10,436 | 10,314 | 10,643 |
| 2014 | 9,855 | 9,111 | 9,698 | 9,528 | 10,642 | 10,827 | 11,579 | 10,248 | 9,413 | 9,873 | 9,776 | 9,688 |
| 2015 | 9,337 | 8,779 | 9,217 | 9,425 | 10,198 | 10,458 | 10,974 | 10,382 | 9,785 | 9,994 | 9,368 | 9,555 |
| 2016 | 9,332 | 8,891 | 8,903 | 9,395 | 10,228 | 10,462 | 10,597 | 10,608 | 9,807 | 10,054 | 9,413 | 9,890 |
| 2017 | 8,989 | 8,219 | 9,306 | 8,945 | 10,067 | 10,260 | 10,242 | 10,393 | 9,161 | 9,652 | 9,366 | 9,229 |
| 2018 | 8,962 | 8,285 | 8,701 | 8,428 | 9,707 | 9,790 | 10,045 | 9,999 | 8,685 | 9,453 | 8,682 | 8,333 |
| 2019 | 8,443 | 7,804 | 8,720 | 8,620 | 9,970 | 9,708 | 10,601 | 10,431 | 8,909 | 9,905 | 9,628 | 9,324 |
| 2020 | 8,733 | 8,370 | 7,732 | 5,886 | 7,881 | 8,820 | 9,643 | 9,498 | 8,971 | 9,037 | 7,867 | 8,091 |
| 2021 | 7,922 | 7,886 | 8,405 | 8,832 | 9,830 | 10,298 | 10,316 | 9,919 | 9,549 | 9,324 | 8,962 | 8,896 |
| 2022 | 8,456 | 8,144 | 8,643 | 8,426 | 9,508 | 9,588 | 9,802 | 10,006 | 9,247 | 9,509 | 8,832 | 8,588 |
| 2023 | 8,369 | 7,801 | 8,393 | 8,016 | 9,540 | 9,738 | 9,601 | 9,763 | 8,689 | 9,308 | 8,812 | 8,614 |
| 2024 | 8,361 | |||||||||||
| - = No Data Reported; -- = Not Applicable; NA = Not Available; W = Withheld to avoid disclosure of individual company data. |
| Release Date: 3/29/2024 |
| Next Release Date: 4/30/2024 |