|
Download Data (XLS File) |
|
||||||||
|
||||||||
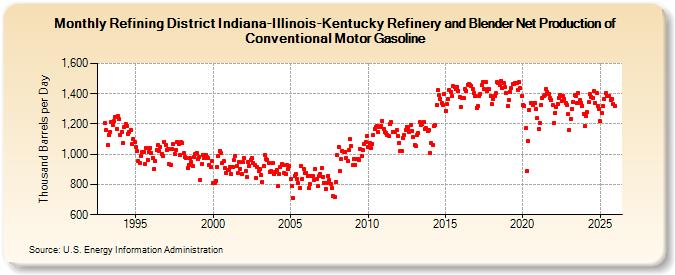
| Refining District Indiana-Illinois-Kentucky Refinery and Blender Net Production of Conventional Motor Gasoline (Thousand Barrels per Day) | ||||||||
| Year | Jan | Feb | Mar | Apr | May | Jun | Jul | Aug | Sep | Oct | Nov | Dec |
|---|---|---|---|---|---|---|---|---|---|---|---|---|
| 1993 | 1,205 | 1,160 | 1,060 | 1,128 | 1,148 | 1,216 | 1,196 | 1,217 | 1,249 | 1,170 | 1,253 | 1,232 |
| 1994 | 1,127 | 1,149 | 1,074 | 1,177 | 1,201 | 1,187 | 1,135 | 1,144 | 1,160 | 1,068 | 1,100 | 1,083 |
| 1995 | 1,046 | 1,021 | 955 | 943 | 989 | 1,013 | 1,014 | 936 | 1,043 | 964 | 1,017 | 1,044 |
| 1996 | 1,009 | 977 | 902 | 955 | 1,029 | 1,058 | 1,021 | 1,048 | 1,002 | 990 | 1,083 | 1,062 |
| 1997 | 1,031 | 1,034 | 933 | 932 | 1,035 | 1,066 | 1,002 | 1,031 | 1,083 | 1,066 | 997 | 1,082 |
| 1998 | 1,073 | 1,008 | 982 | 977 | 906 | 926 | 972 | 948 | 923 | 979 | 1,003 | 1,010 |
| 1999 | 967 | 983 | 830 | 936 | 997 | 977 | 993 | 980 | 972 | 929 | 917 | 953 |
| 2000 | 811 | 812 | 825 | 917 | 986 | 1,022 | 1,005 | 944 | 953 | 910 | 877 | 895 |
| 2001 | 895 | 916 | 869 | 913 | 959 | 990 | 921 | 876 | 949 | 905 | 869 | 948 |
| 2002 | 972 | 886 | 850 | 949 | 925 | 964 | 975 | 942 | 927 | 843 | 915 | 889 |
| 2003 | 902 | 860 | 819 | 925 | 996 | 967 | 962 | 945 | 885 | 891 | 942 | 869 |
| 2004 | 883 | 898 | 789 | 871 | 916 | 936 | 927 | 875 | 866 | 926 | 905 | 919 |
| 2005 | 833 | 792 | 709 | 858 | 868 | 836 | 807 | 776 | 923 | 839 | 902 | 877 |
| 2006 | 873 | 857 | 776 | 800 | 853 | 858 | 830 | 899 | 833 | 789 | 854 | 872 |
| 2007 | 910 | 852 | 812 | 772 | 811 | 856 | 827 | 806 | 776 | 721 | 715 | 819 |
| 2008 | 992 | 1,049 | 886 | 968 | 1,022 | 1,017 | 1,017 | 973 | 956 | 1,027 | 1,100 | 1,054 |
| 2009 | 926 | 969 | 929 | 966 | 970 | 964 | 1,035 | 990 | 1,025 | 1,068 | 1,083 | 1,120 |
| 2010 | 1,046 | 1,072 | 1,044 | 1,069 | 1,125 | 1,167 | 1,182 | 1,185 | 1,145 | 1,179 | 1,188 | 1,222 |
| 2011 | 1,165 | 1,148 | 1,142 | 1,125 | 1,121 | 1,203 | 1,212 | 1,148 | 1,150 | 1,147 | 1,160 | 1,122 |
| 2012 | 1,075 | 1,022 | 1,019 | 1,110 | 1,129 | 1,158 | 1,181 | 1,175 | 1,145 | 1,195 | 1,154 | 1,111 |
| 2013 | 1,060 | 1,053 | 1,128 | 1,140 | 1,211 | 1,194 | 1,201 | 1,212 | 1,164 | 1,171 | 1,152 | 1,157 |
| 2014 | 1,010 | 1,072 | 1,061 | 1,188 | 1,191 | 1,324 | 1,422 | 1,390 | 1,368 | 1,340 | 1,324 | 1,401 |
| 2015 | 1,287 | 1,330 | 1,362 | 1,424 | 1,410 | 1,383 | 1,450 | 1,444 | 1,429 | 1,445 | 1,418 | 1,379 |
| 2016 | 1,314 | 1,369 | 1,373 | 1,428 | 1,418 | 1,461 | 1,463 | 1,460 | 1,451 | 1,434 | 1,404 | 1,387 |
| 2017 | 1,308 | 1,316 | 1,382 | 1,400 | 1,457 | 1,477 | 1,429 | 1,480 | 1,416 | 1,428 | 1,431 | 1,385 |
| 2018 | 1,329 | 1,363 | 1,386 | 1,402 | 1,475 | 1,470 | 1,456 | 1,486 | 1,436 | 1,469 | 1,444 | 1,406 |
| 2019 | 1,322 | 1,359 | 1,414 | 1,435 | 1,464 | 1,466 | 1,472 | 1,469 | 1,426 | 1,478 | 1,438 | 1,383 |
| 2020 | 1,326 | 1,319 | 1,173 | 886 | 1,086 | 1,295 | 1,340 | 1,341 | 1,327 | 1,337 | 1,296 | 1,238 |
| 2021 | 1,165 | 1,206 | 1,325 | 1,372 | 1,388 | 1,394 | 1,430 | 1,411 | 1,401 | 1,372 | 1,360 | 1,323 |
| 2022 | 1,204 | 1,275 | 1,315 | 1,334 | 1,375 | 1,390 | 1,354 | 1,384 | 1,366 | 1,340 | 1,323 | 1,264 |
| 2023 | 1,160 | 1,235 | 1,300 | 1,348 | 1,389 | 1,387 | 1,336 | 1,404 | 1,361 | 1,339 | 1,320 | 1,268 |
| 2024 | 1,170 | |||||||||||
| - = No Data Reported; -- = Not Applicable; NA = Not Available; W = Withheld to avoid disclosure of individual company data. |
| Release Date: 3/29/2024 |
| Next Release Date: 4/30/2024 |