|
Download Data (XLS File) |
|
||||||||
|
||||||||
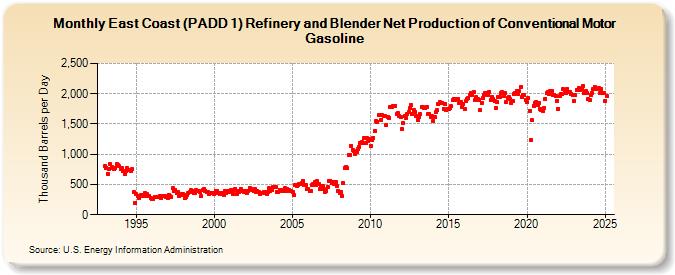
| East Coast (PADD 1) Refinery and Blender Net Production of Conventional Motor Gasoline (Thousand Barrels per Day) | ||||||||
| Year | Jan | Feb | Mar | Apr | May | Jun | Jul | Aug | Sep | Oct | Nov | Dec |
|---|---|---|---|---|---|---|---|---|---|---|---|---|
| 1993 | 803 | 780 | 679 | 757 | 832 | 791 | 771 | 750 | 773 | 834 | 824 | 799 |
| 1994 | 752 | 773 | 721 | 669 | 716 | 767 | 731 | 738 | 723 | 750 | 371 | 195 |
| 1995 | 342 | 314 | 280 | 314 | 327 | 320 | 304 | 351 | 349 | 315 | 312 | 273 |
| 1996 | 256 | 254 | 296 | 291 | 287 | 285 | 303 | 276 | 304 | 313 | 306 | 287 |
| 1997 | 277 | 328 | 302 | 294 | 434 | 389 | 410 | 362 | 369 | 303 | 328 | 348 |
| 1998 | 335 | 282 | 296 | 327 | 362 | 368 | 404 | 400 | 356 | 367 | 401 | 388 |
| 1999 | 395 | 382 | 305 | 411 | 433 | 399 | 375 | 380 | 342 | 352 | 366 | 356 |
| 2000 | 341 | 398 | 395 | 365 | 348 | 366 | 361 | 332 | 393 | 367 | 385 | 374 |
| 2001 | 392 | 402 | 350 | 410 | 427 | 341 | 384 | 382 | 421 | 387 | 397 | 368 |
| 2002 | 391 | 359 | 391 | 434 | 431 | 415 | 399 | 426 | 379 | 392 | 372 | 336 |
| 2003 | 352 | 360 | 374 | 381 | 343 | 371 | 435 | 393 | 414 | 455 | 459 | 462 |
| 2004 | 375 | 381 | 416 | 409 | 393 | 390 | 434 | 398 | 428 | 409 | 390 | 398 |
| 2005 | 371 | 324 | 487 | 480 | 485 | 505 | 513 | 521 | 557 | 493 | 484 | 427 |
| 2006 | 424 | 395 | 392 | 499 | 510 | 543 | 497 | 555 | 512 | 433 | 478 | 473 |
| 2007 | 420 | 381 | 392 | 454 | 565 | 564 | 528 | 535 | 500 | 544 | 472 | 395 |
| 2008 | 364 | 381 | 309 | 522 | 775 | 790 | 771 | 988 | 992 | 1,142 | 1,077 | 1,053 |
| 2009 | 1,003 | 1,030 | 1,082 | 1,125 | 1,189 | 1,200 | 1,183 | 1,264 | 1,191 | 1,261 | 1,226 | 1,245 |
| 2010 | 1,143 | 1,237 | 1,274 | 1,390 | 1,550 | 1,540 | 1,642 | 1,656 | 1,573 | 1,641 | 1,624 | 1,626 |
| 2011 | 1,476 | 1,617 | 1,600 | 1,775 | 1,783 | 1,795 | 1,803 | 1,805 | 1,668 | 1,681 | 1,628 | 1,608 |
| 2012 | 1,416 | 1,517 | 1,630 | 1,605 | 1,670 | 1,699 | 1,759 | 1,817 | 1,662 | 1,723 | 1,701 | 1,632 |
| 2013 | 1,569 | 1,621 | 1,661 | 1,785 | 1,788 | 1,756 | 1,760 | 1,782 | 1,660 | 1,662 | 1,616 | 1,634 |
| 2014 | 1,556 | 1,619 | 1,691 | 1,723 | 1,836 | 1,858 | 1,853 | 1,853 | 1,749 | 1,834 | 1,728 | 1,751 |
| 2015 | 1,740 | 1,768 | 1,792 | 1,894 | 1,921 | 1,904 | 1,917 | 1,921 | 1,845 | 1,867 | 1,787 | 1,832 |
| 2016 | 1,751 | 1,878 | 1,921 | 1,933 | 1,984 | 2,011 | 1,984 | 2,021 | 1,893 | 1,939 | 1,908 | 1,904 |
| 2017 | 1,728 | 1,854 | 1,927 | 1,978 | 2,019 | 2,009 | 1,986 | 2,031 | 1,895 | 1,943 | 1,910 | 1,873 |
| 2018 | 1,764 | 1,856 | 1,944 | 1,940 | 2,004 | 2,021 | 1,962 | 2,006 | 1,865 | 1,932 | 1,943 | 1,905 |
| 2019 | 1,850 | 1,876 | 1,999 | 2,019 | 2,044 | 1,994 | 2,039 | 2,114 | 1,943 | 1,986 | 1,971 | 1,902 |
| 2020 | 1,859 | 1,929 | 1,721 | 1,234 | 1,559 | 1,804 | 1,846 | 1,868 | 1,818 | 1,852 | 1,743 | 1,723 |
| 2021 | 1,707 | 1,767 | 1,918 | 2,005 | 2,034 | 1,993 | 2,047 | 2,043 | 1,984 | 1,980 | 1,962 | 1,887 |
| 2022 | 1,755 | 1,960 | 1,993 | 1,990 | 2,074 | 2,056 | 2,013 | 2,082 | 2,031 | 2,023 | 1,999 | 1,979 |
| 2023 | 1,874 | 1,970 | 2,054 | 2,052 | 2,087 | 2,054 | 2,077 | 2,124 | 2,006 | 2,041 | 2,017 | 1,908 |
| 2024 | 1,890 | |||||||||||
| - = No Data Reported; -- = Not Applicable; NA = Not Available; W = Withheld to avoid disclosure of individual company data. |
| Release Date: 3/29/2024 |
| Next Release Date: 4/30/2024 |