|
Download Data (XLS File) |
|
||||||||
|
||||||||
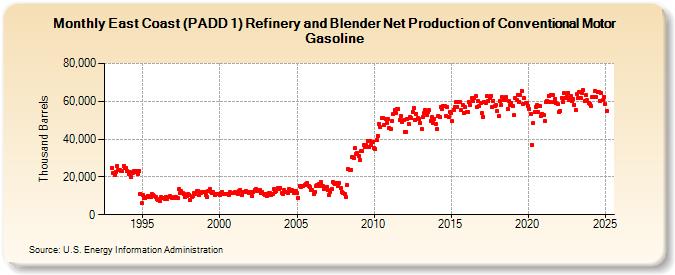
| East Coast (PADD 1) Refinery and Blender Net Production of Conventional Motor Gasoline (Thousand Barrels) | ||||||||
| Year | Jan | Feb | Mar | Apr | May | Jun | Jul | Aug | Sep | Oct | Nov | Dec |
|---|---|---|---|---|---|---|---|---|---|---|---|---|
| 1993 | 24,884 | 21,815 | 21,024 | 22,705 | 25,784 | 23,724 | 23,889 | 23,259 | 23,203 | 25,842 | 24,727 | 24,756 |
| 1994 | 23,326 | 21,632 | 22,357 | 20,078 | 22,220 | 23,013 | 22,659 | 22,873 | 21,675 | 23,237 | 11,108 | 6,044 |
| 1995 | 10,601 | 8,785 | 8,664 | 9,417 | 10,120 | 9,590 | 9,432 | 10,879 | 10,457 | 9,774 | 9,346 | 8,466 |
| 1996 | 7,933 | 7,369 | 9,172 | 8,720 | 8,889 | 8,546 | 9,406 | 8,569 | 9,120 | 9,717 | 9,192 | 8,889 |
| 1997 | 8,583 | 9,180 | 9,365 | 8,809 | 13,440 | 11,684 | 12,717 | 11,230 | 11,084 | 9,399 | 9,849 | 10,778 |
| 1998 | 10,376 | 7,885 | 9,185 | 9,796 | 11,226 | 11,045 | 12,527 | 12,409 | 10,679 | 11,391 | 12,031 | 12,019 |
| 1999 | 12,236 | 10,678 | 9,456 | 12,322 | 13,411 | 11,958 | 11,624 | 11,765 | 10,271 | 10,917 | 10,988 | 11,023 |
| 2000 | 10,571 | 11,542 | 12,257 | 10,946 | 10,773 | 10,994 | 11,177 | 10,280 | 11,798 | 11,380 | 11,537 | 11,604 |
| 2001 | 12,150 | 11,243 | 10,852 | 12,290 | 13,248 | 10,230 | 11,913 | 11,853 | 12,620 | 12,003 | 11,916 | 11,402 |
| 2002 | 12,129 | 10,047 | 12,118 | 13,013 | 13,370 | 12,438 | 12,366 | 13,205 | 11,380 | 12,132 | 11,152 | 10,428 |
| 2003 | 10,936 | 10,062 | 11,592 | 11,449 | 10,612 | 11,129 | 13,501 | 12,191 | 12,438 | 14,124 | 13,754 | 14,323 |
| 2004 | 11,620 | 11,037 | 12,907 | 12,270 | 12,180 | 11,702 | 13,455 | 12,336 | 12,838 | 12,687 | 11,685 | 12,325 |
| 2005 | 11,515 | 9,081 | 15,082 | 14,405 | 15,035 | 15,140 | 15,897 | 16,148 | 16,700 | 15,272 | 14,507 | 13,239 |
| 2006 | 13,155 | 11,072 | 12,152 | 14,959 | 15,806 | 16,288 | 15,400 | 17,208 | 15,353 | 13,429 | 14,350 | 14,674 |
| 2007 | 13,008 | 10,664 | 12,149 | 13,606 | 17,522 | 16,931 | 16,378 | 16,592 | 14,990 | 16,869 | 14,155 | 12,257 |
| 2008 | 11,286 | 11,052 | 9,593 | 15,667 | 24,018 | 23,712 | 23,902 | 30,620 | 29,768 | 35,417 | 32,317 | 32,634 |
| 2009 | 31,081 | 28,840 | 33,528 | 33,755 | 36,852 | 35,995 | 36,660 | 39,171 | 35,731 | 39,084 | 36,788 | 38,608 |
| 2010 | 35,444 | 34,640 | 39,508 | 41,703 | 48,035 | 46,188 | 50,898 | 51,330 | 47,194 | 50,874 | 48,716 | 50,396 |
| 2011 | 45,743 | 45,284 | 49,597 | 53,243 | 55,279 | 53,839 | 55,906 | 55,965 | 50,041 | 52,099 | 48,832 | 49,842 |
| 2012 | 43,899 | 43,989 | 50,533 | 48,135 | 51,758 | 50,975 | 54,543 | 56,325 | 49,855 | 53,419 | 51,035 | 50,581 |
| 2013 | 48,634 | 45,377 | 51,481 | 53,543 | 55,440 | 52,693 | 54,558 | 55,229 | 49,806 | 51,532 | 48,472 | 50,644 |
| 2014 | 48,226 | 45,334 | 52,428 | 51,691 | 56,923 | 55,734 | 57,440 | 57,442 | 52,471 | 56,862 | 51,833 | 54,271 |
| 2015 | 53,952 | 49,491 | 55,556 | 56,833 | 59,557 | 57,120 | 59,418 | 59,547 | 55,353 | 57,862 | 53,600 | 56,791 |
| 2016 | 54,277 | 54,466 | 59,544 | 58,000 | 61,510 | 60,318 | 61,494 | 62,648 | 56,775 | 60,104 | 57,245 | 59,011 |
| 2017 | 53,563 | 51,924 | 59,739 | 59,343 | 62,579 | 60,270 | 61,557 | 62,960 | 56,861 | 60,220 | 57,296 | 58,072 |
| 2018 | 54,683 | 51,980 | 60,279 | 58,200 | 62,117 | 60,639 | 60,837 | 62,178 | 55,947 | 59,891 | 58,279 | 59,043 |
| 2019 | 57,350 | 52,522 | 61,982 | 60,576 | 63,360 | 59,812 | 63,202 | 65,524 | 58,303 | 61,562 | 59,127 | 58,965 |
| 2020 | 57,626 | 55,942 | 53,342 | 37,011 | 48,318 | 54,127 | 57,241 | 57,894 | 54,538 | 57,418 | 52,276 | 53,403 |
| 2021 | 52,922 | 49,474 | 59,454 | 60,137 | 63,060 | 59,789 | 63,457 | 63,331 | 59,510 | 61,385 | 58,853 | 58,482 |
| 2022 | 54,399 | 54,884 | 61,772 | 59,692 | 64,306 | 61,670 | 62,406 | 64,531 | 60,930 | 62,722 | 59,972 | 61,338 |
| 2023 | 58,099 | 55,155 | 63,665 | 61,554 | 64,704 | 61,624 | 64,399 | 65,844 | 60,192 | 63,272 | 60,508 | 59,158 |
| 2024 | 58,576 | |||||||||||
| - = No Data Reported; -- = Not Applicable; NA = Not Available; W = Withheld to avoid disclosure of individual company data. |
| Release Date: 3/29/2024 |
| Next Release Date: 4/30/2024 |