|
Download Data (XLS File) |
|
||||||||
|
||||||||
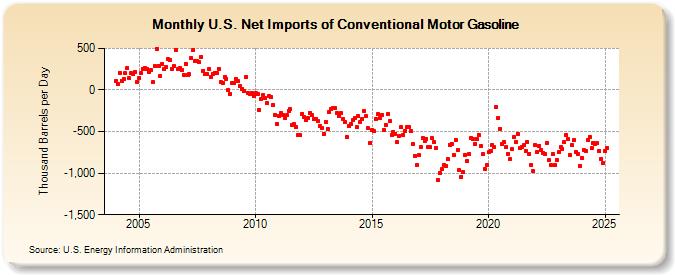
| U.S. Net Imports of Conventional Motor Gasoline (Thousand Barrels per Day) | ||||||||
| Year | Jan | Feb | Mar | Apr | May | Jun | Jul | Aug | Sep | Oct | Nov | Dec |
|---|---|---|---|---|---|---|---|---|---|---|---|---|
| 2004 | 102 | 73 | 208 | 112 | 130 | 203 | 262 | 139 | 203 | 187 | 219 | 99 |
| 2005 | 141 | 200 | 257 | 264 | 254 | 212 | 239 | 91 | 285 | 493 | 294 | 166 |
| 2006 | 312 | 255 | 275 | 370 | 356 | 258 | 289 | 482 | 251 | 265 | 242 | 186 |
| 2007 | 317 | 181 | 188 | 383 | 486 | 354 | 345 | 339 | 402 | 233 | 191 | 191 |
| 2008 | 255 | 158 | 197 | 209 | 205 | 258 | 98 | 82 | 159 | 135 | -1 | -49 |
| 2009 | 80 | 81 | 131 | 104 | 43 | 13 | -9 | 153 | -35 | -48 | -36 | -75 |
| 2010 | -39 | -52 | -236 | -113 | -61 | -100 | -158 | -75 | -85 | -182 | -295 | -407 |
| 2011 | -308 | -282 | -300 | -333 | -306 | -250 | -232 | -420 | -413 | -449 | -544 | -545 |
| 2012 | -284 | -319 | -365 | -343 | -272 | -306 | -350 | -346 | -374 | -436 | -452 | -526 |
| 2013 | -387 | -470 | -260 | -227 | -212 | -219 | -276 | -310 | -280 | -345 | -388 | -570 |
| 2014 | -433 | -412 | -365 | -338 | -448 | -317 | -381 | -347 | -258 | -318 | -456 | -632 |
| 2015 | -478 | -497 | -344 | -290 | -343 | -299 | -480 | -416 | -294 | -375 | -542 | -500 |
| 2016 | -526 | -631 | -549 | -448 | -537 | -492 | -446 | -446 | -498 | -648 | -790 | -907 |
| 2017 | -785 | -682 | -579 | -615 | -585 | -684 | -689 | -581 | -630 | -702 | -1,080 | -995 |
| 2018 | -956 | -901 | -913 | -834 | -658 | -645 | -786 | -599 | -721 | -967 | -1,043 | -989 |
| 2019 | -781 | -860 | -770 | -579 | -591 | -646 | -592 | -547 | -672 | -774 | -949 | -902 |
| 2020 | -746 | -732 | -661 | -686 | -206 | -335 | -464 | -652 | -627 | -689 | -769 | -834 |
| 2021 | -713 | -566 | -622 | -525 | -698 | -687 | -665 | -735 | -628 | -764 | -901 | -979 |
| 2022 | -661 | -743 | -668 | -719 | -753 | -767 | -633 | -846 | -906 | -770 | -899 | -843 |
| 2023 | -776 | -709 | -768 | -580 | -525 | -637 | -741 | -647 | -616 | -744 | -760 | -911 |
| 2024 | -815 | |||||||||||
| - = No Data Reported; -- = Not Applicable; NA = Not Available; W = Withheld to avoid disclosure of individual company data. |
| Release Date: 3/29/2024 |
| Next Release Date: 4/30/2024 |