|
Download Data (XLS File) |
|
||||||||
|
||||||||
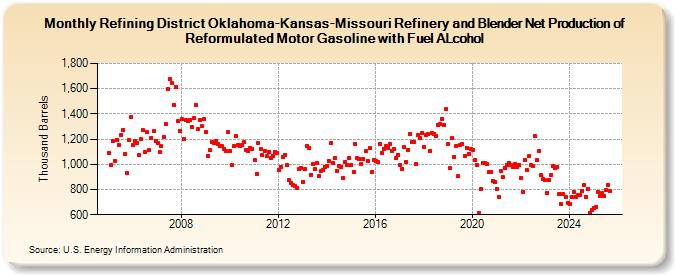
| Refining District Oklahoma-Kansas-Missouri Refinery and Blender Net Production of Reformulated Motor Gasoline with Fuel ALcohol (Thousand Barrels) | ||||||||
| Year | Jan | Feb | Mar | Apr | May | Jun | Jul | Aug | Sep | Oct | Nov | Dec |
|---|---|---|---|---|---|---|---|---|---|---|---|---|
| 2005 | 1,089 | 998 | 1,183 | 1,030 | 1,195 | 1,153 | 1,235 | 1,275 | 1,082 | 929 | 1,193 | 1,375 |
| 2006 | 1,155 | 1,188 | 1,170 | 1,072 | 1,198 | 1,269 | 1,096 | 1,255 | 1,110 | 1,212 | 1,261 | 1,187 |
| 2007 | 1,169 | 1,095 | 1,144 | 1,213 | 1,322 | 1,595 | 1,677 | 1,647 | 1,473 | 1,616 | 1,340 | 1,263 |
| 2008 | 1,357 | 1,202 | 1,348 | 1,342 | 1,355 | 1,295 | 1,364 | 1,469 | 1,277 | 1,348 | 1,302 | 1,363 |
| 2009 | 1,259 | 1,066 | 1,110 | 1,178 | 1,168 | 1,186 | 1,163 | 1,146 | 1,142 | 1,120 | 1,109 | 1,253 |
| 2010 | 1,102 | 994 | 1,143 | 1,223 | 1,157 | 1,142 | 1,153 | 1,174 | 1,115 | 1,105 | 1,127 | 1,121 |
| 2011 | 1,035 | 927 | 1,172 | 1,122 | 1,072 | 1,102 | 1,065 | 1,096 | 1,051 | 1,068 | 1,099 | 1,086 |
| 2012 | 955 | 979 | 1,056 | 1,076 | 994 | 873 | 853 | 834 | 827 | 809 | 961 | 973 |
| 2013 | 861 | 963 | 1,142 | 1,129 | 918 | 1,001 | 961 | 1,011 | 906 | 947 | 957 | 977 |
| 2014 | 988 | 1,026 | 1,171 | 1,011 | 1,052 | 949 | 988 | 982 | 891 | 1,015 | 995 | 1,053 |
| 2015 | 995 | 940 | 1,165 | 1,051 | 1,042 | 1,005 | 1,041 | 1,102 | 1,027 | 1,131 | 937 | 1,037 |
| 2016 | 1,030 | 1,019 | 1,161 | 1,088 | 1,122 | 1,142 | 1,129 | 1,160 | 1,103 | 1,120 | 1,050 | 1,077 |
| 2017 | 992 | 965 | 1,139 | 1,018 | 1,117 | 1,240 | 1,176 | 1,175 | 1,003 | 1,231 | 1,212 | 1,252 |
| 2018 | 1,141 | 1,234 | 1,237 | 1,107 | 1,251 | 1,243 | 1,225 | 1,311 | 1,321 | 1,362 | 1,314 | 1,436 |
| 2019 | 1,161 | 969 | 1,205 | 1,057 | 1,148 | 904 | 1,156 | 1,163 | 1,069 | 1,132 | 1,082 | 1,119 |
| 2020 | 1,116 | 1,036 | 991 | 610 | 802 | 1,011 | 1,011 | 999 | 935 | 939 | 870 | 862 |
| 2021 | 806 | 741 | 944 | 896 | 967 | 992 | 1,013 | 992 | 981 | 1,005 | 976 | 992 |
| 2022 | 894 | 784 | 1,037 | 952 | 1,068 | 993 | 986 | 1,222 | 1,031 | 1,108 | 913 | 882 |
| 2023 | 873 | 773 | 878 | 917 | 990 | 969 | 976 | 767 | 687 | 762 | 739 | 695 |
| 2024 | 682 | |||||||||||
| - = No Data Reported; -- = Not Applicable; NA = Not Available; W = Withheld to avoid disclosure of individual company data. |
| Release Date: 3/29/2024 |
| Next Release Date: 4/30/2024 |