|
Download Data (XLS File) |
|
||||||||
|
||||||||
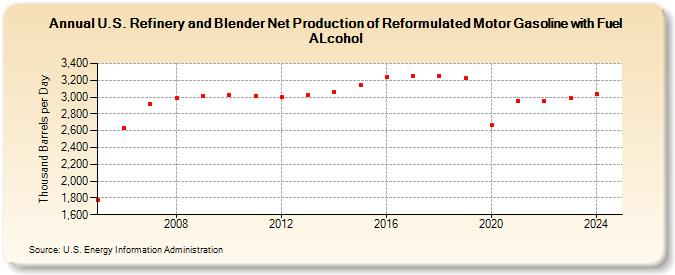
| U.S. Refinery and Blender Net Production of Reformulated Motor Gasoline with Fuel ALcohol (Thousand Barrels per Day) | ||||||||
| Decade | Year-0 | Year-1 | Year-2 | Year-3 | Year-4 | Year-5 | Year-6 | Year-7 | Year-8 | Year-9 |
|---|---|---|---|---|---|---|---|---|---|---|
| 2000's | 1,777 | 2,631 | 2,914 | 2,984 | 3,012 | |||||
| 2010's | 3,019 | 3,016 | 2,996 | 3,028 | 3,066 | 3,146 | 3,242 | 3,252 | 3,251 | 3,223 |
| 2020's | 2,672 | 2,953 | 2,951 | 2,986 | 3,038 |
| - = No Data Reported; -- = Not Applicable; NA = Not Available; W = Withheld to avoid disclosure of individual company data. |
| Release Date: 6/30/2025 |
| Next Release Date: 8/29/2025 |