|
Download Data (XLS File) |
|
||||||||
|
||||||||
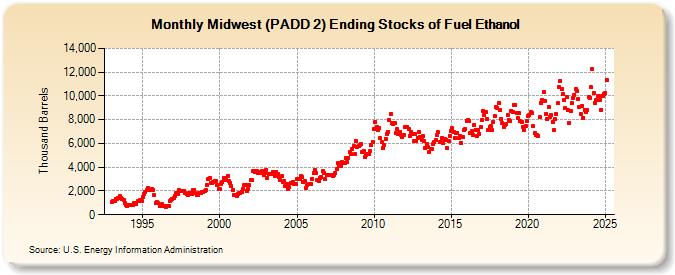
| Midwest (PADD 2) Ending Stocks of Fuel Ethanol (Thousand Barrels) | ||||||||
| Year | Jan | Feb | Mar | Apr | May | Jun | Jul | Aug | Sep | Oct | Nov | Dec |
|---|---|---|---|---|---|---|---|---|---|---|---|---|
| 1993 | 1,094 | 1,124 | 1,143 | 1,327 | 1,322 | 1,413 | 1,570 | 1,408 | 1,314 | 1,269 | 981 | 779 |
| 1994 | 750 | 786 | 833 | 834 | 836 | 1,000 | 979 | 940 | 1,129 | 1,152 | 1,241 | 1,190 |
| 1995 | 1,459 | 1,761 | 1,881 | 2,060 | 2,285 | 2,097 | 2,116 | 2,149 | 2,103 | 1,669 | 969 | 1,112 |
| 1996 | 960 | 766 | 849 | 870 | 753 | 696 | 653 | 701 | 722 | 1,131 | 1,198 | 1,336 |
| 1997 | 1,396 | 1,612 | 1,838 | 1,758 | 2,049 | 1,961 | 2,011 | 2,014 | 2,018 | 1,811 | 1,703 | 1,696 |
| 1998 | 1,866 | 1,860 | 1,748 | 2,095 | 2,115 | 1,840 | 1,687 | 1,693 | 1,832 | 1,820 | 1,886 | 1,893 |
| 1999 | 2,001 | 2,062 | 2,484 | 3,030 | 3,050 | 2,658 | 2,630 | 2,756 | 2,826 | 2,831 | 2,501 | 2,151 |
| 2000 | 2,154 | 2,624 | 2,716 | 3,080 | 2,905 | 3,106 | 3,234 | 2,801 | 2,676 | 2,395 | 2,048 | 1,644 |
| 2001 | 1,634 | 1,563 | 1,739 | 1,826 | 1,836 | 1,943 | 2,174 | 2,464 | 2,523 | 1,957 | 2,184 | 2,479 |
| 2002 | 2,890 | 2,932 | 3,652 | 3,614 | 3,702 | 3,642 | 3,524 | 3,553 | 3,600 | 3,682 | 3,370 | 3,486 |
| 2003 | 3,787 | 3,114 | 3,450 | 3,448 | 3,466 | 3,581 | 3,443 | 3,236 | 3,608 | 3,447 | 3,135 | 2,941 |
| 2004 | 3,217 | 2,793 | 2,796 | 2,456 | 2,605 | 2,133 | 2,296 | 2,674 | 2,647 | 2,772 | 2,580 | 2,563 |
| 2005 | 3,042 | 3,028 | 3,023 | 3,224 | 3,188 | 2,736 | 2,813 | 2,282 | 2,471 | 2,559 | 2,572 | 2,591 |
| 2006 | 3,041 | 3,521 | 3,758 | 3,552 | 2,885 | 2,871 | 3,121 | 3,193 | 3,674 | 3,495 | 3,002 | 3,320 |
| 2007 | 3,344 | 3,344 | 3,333 | 3,307 | 3,239 | 3,383 | 3,548 | 3,870 | 4,344 | 4,122 | 4,124 | 4,405 |
| 2008 | 4,323 | 4,362 | 4,765 | 4,400 | 4,811 | 5,253 | 5,127 | 5,547 | 5,773 | 5,086 | 6,177 | 5,712 |
| 2009 | 5,796 | 5,877 | 5,950 | 5,281 | 5,378 | 4,820 | 5,045 | 5,133 | 5,093 | 5,340 | 5,830 | 6,150 |
| 2010 | 7,203 | 7,835 | 7,379 | 7,140 | 7,335 | 6,425 | 6,091 | 5,645 | 5,889 | 6,404 | 6,787 | 6,953 |
| 2011 | 7,949 | 8,484 | 7,718 | 7,603 | 7,753 | 6,841 | 7,211 | 6,765 | 6,958 | 6,746 | 6,533 | 6,688 |
| 2012 | 7,379 | 7,386 | 7,354 | 7,187 | 6,653 | 6,962 | 6,766 | 6,163 | 6,795 | 6,172 | 6,486 | 7,002 |
| 2013 | 6,503 | 6,299 | 6,618 | 6,240 | 5,607 | 5,915 | 5,683 | 5,304 | 5,569 | 5,525 | 5,925 | 6,081 |
| 2014 | 6,325 | 6,717 | 6,928 | 6,120 | 6,084 | 6,457 | 6,011 | 6,353 | 6,303 | 5,627 | 6,206 | 6,636 |
| 2015 | 7,068 | 7,264 | 6,974 | 6,480 | 6,875 | 6,886 | 6,446 | 6,667 | 6,045 | 6,514 | 7,091 | 7,216 |
| 2016 | 7,914 | 7,966 | 7,914 | 6,868 | 7,016 | 6,725 | 7,581 | 7,171 | 6,608 | 7,124 | 6,821 | 7,349 |
| 2017 | 8,013 | 8,734 | 8,427 | 8,635 | 8,061 | 7,089 | 7,401 | 7,431 | 7,129 | 7,807 | 8,285 | 9,102 |
| 2018 | 9,019 | 9,384 | 8,800 | 8,094 | 7,730 | 7,417 | 7,558 | 7,651 | 8,378 | 7,972 | 7,873 | 8,759 |
| 2019 | 8,662 | 9,230 | 9,263 | 8,599 | 8,140 | 8,523 | 7,852 | 7,762 | 7,403 | 7,157 | 7,472 | 7,865 |
| 2020 | 8,328 | 8,417 | 8,646 | 8,530 | 7,472 | 6,889 | 6,736 | 6,720 | 6,610 | 8,183 | 9,431 | 9,672 |
| 2021 | 10,327 | 9,561 | 8,493 | 8,030 | 9,104 | 8,249 | 8,391 | 7,817 | 7,131 | 8,026 | 8,466 | 9,381 |
| 2022 | 10,741 | 11,282 | 10,579 | 10,149 | 9,619 | 8,964 | 9,918 | 8,796 | 7,727 | 8,691 | 9,401 | 9,826 |
| 2023 | 10,267 | 10,575 | 10,447 | 9,746 | 9,038 | 8,432 | 9,198 | 8,178 | 8,782 | 8,701 | 8,793 | 9,930 |
| 2024 | 9,851 | |||||||||||
| - = No Data Reported; -- = Not Applicable; NA = Not Available; W = Withheld to avoid disclosure of individual company data. |
| Release Date: 3/29/2024 |
| Next Release Date: 4/30/2024 |