|
Download Data (XLS File) |
|
||||||||
|
||||||||
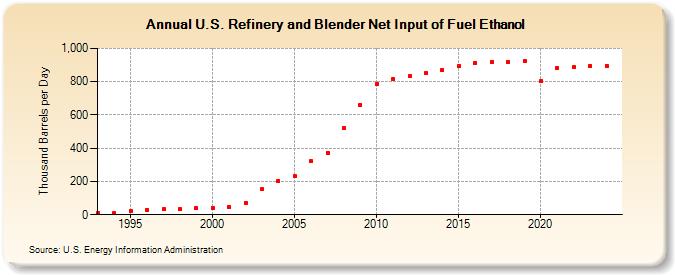
| U.S. Refinery and Blender Net Input of Fuel Ethanol (Thousand Barrels per Day) | ||||||||
| Decade | Year-0 | Year-1 | Year-2 | Year-3 | Year-4 | Year-5 | Year-6 | Year-7 | Year-8 | Year-9 |
|---|---|---|---|---|---|---|---|---|---|---|
| 1990's | 9 | 10 | 25 | 30 | 32 | 32 | 38 | |||
| 2000's | 42 | 46 | 72 | 152 | 202 | 230 | 321 | 374 | 519 | 660 |
| 2010's | 783 | 814 | 831 | 851 | 869 | 893 | 915 | 918 | 921 | 924 |
| 2020's | 802 | 881 | 887 | 896 |
| - = No Data Reported; -- = Not Applicable; NA = Not Available; W = Withheld to avoid disclosure of individual company data. |
| Release Date: 3/29/2024 |
| Next Release Date: 8/30/2024 |