|
Download Data (XLS File) |
|
||||||||
|
||||||||
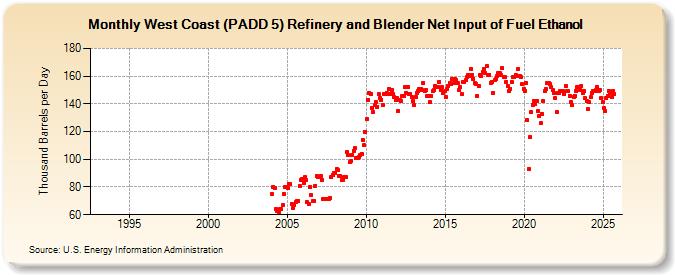
| West Coast (PADD 5) Refinery and Blender Net Input of Fuel Ethanol (Thousand Barrels per Day) | ||||||||
| Year | Jan | Feb | Mar | Apr | May | Jun | Jul | Aug | Sep | Oct | Nov | Dec |
|---|---|---|---|---|---|---|---|---|---|---|---|---|
| 1993 | W | W | W | W | W | W | ||||||
| 1994 | W | W | W | W | ||||||||
| 1995 | W | W | W | W | W | W | W | W | W | W | W | |
| 1996 | W | W | W | W | W | W | W | W | ||||
| 1997 | W | W | W | W | W | W | W | |||||
| 1998 | W | W | W | W | W | W | ||||||
| 1999 | W | W | W | W | W | W | W | W | W | W | W | W |
| 2000 | W | W | W | W | W | W | W | W | W | W | W | W |
| 2001 | W | W | W | W | W | W | W | W | W | W | W | W |
| 2002 | W | W | W | W | W | W | W | W | W | W | W | W |
| 2003 | W | W | W | W | W | W | W | W | W | W | W | W |
| 2004 | 75 | 80 | 79 | 64 | 63 | 62 | 64 | 64 | 67 | 75 | 80 | 80 |
| 2005 | 79 | 82 | 82 | 68 | 65 | 67 | 69 | 70 | 70 | 81 | 85 | 86 |
| 2006 | 83 | 87 | 85 | 69 | 68 | 80 | 74 | 70 | 70 | 81 | 88 | 87 |
| 2007 | 87 | 88 | 85 | 71 | 71 | 71 | 71 | 71 | 72 | 87 | 89 | 90 |
| 2008 | 90 | 93 | 92 | 88 | 88 | 85 | 85 | 87 | 87 | 105 | 103 | 98 |
| 2009 | 99 | 103 | 106 | 108 | 101 | 101 | 102 | 103 | 104 | 114 | 110 | 120 |
| 2010 | 129 | 143 | 148 | 147 | 137 | 134 | 139 | 141 | 138 | 147 | 144 | 143 |
| 2011 | 139 | 147 | 147 | 148 | 147 | 151 | 147 | 150 | 147 | 145 | 143 | 144 |
| 2012 | 135 | 143 | 142 | 146 | 146 | 152 | 148 | 152 | 147 | 147 | 145 | 142 |
| 2013 | 139 | 145 | 148 | 149 | 151 | 151 | 150 | 155 | 149 | 150 | 146 | 146 |
| 2014 | 141 | 146 | 149 | 150 | 153 | 152 | 152 | 156 | 150 | 152 | 148 | 149 |
| 2015 | 145 | 151 | 153 | 155 | 154 | 158 | 155 | 158 | 157 | 155 | 150 | 152 |
| 2016 | 147 | 156 | 156 | 157 | 159 | 161 | 160 | 165 | 161 | 158 | 155 | 154 |
| 2017 | 146 | 153 | 161 | 160 | 163 | 165 | 162 | 167 | 161 | 161 | 155 | 156 |
| 2018 | 148 | 157 | 158 | 160 | 162 | 162 | 161 | 166 | 159 | 159 | 156 | 153 |
| 2019 | 149 | 151 | 156 | 159 | 159 | 161 | 160 | 165 | 160 | 159 | 154 | 151 |
| 2020 | 149 | 155 | 128 | 93 | 116 | 134 | 139 | 142 | 140 | 142 | 135 | 131 |
| 2021 | 126 | 133 | 142 | 149 | 151 | 155 | 155 | 154 | 152 | 150 | 148 | 144 |
| 2022 | 134 | 148 | 148 | 149 | 149 | 149 | 147 | 153 | 149 | 149 | 146 | 141 |
| 2023 | 139 | 145 | 146 | 149 | 152 | 152 | 150 | 153 | 148 | 149 | 144 | 142 |
| 2024 | 136 | |||||||||||
| - = No Data Reported; -- = Not Applicable; NA = Not Available; W = Withheld to avoid disclosure of individual company data. |
| Release Date: 3/29/2024 |
| Next Release Date: 4/30/2024 |