|
Download Data (XLS File) |
|
||||||||
|
||||||||
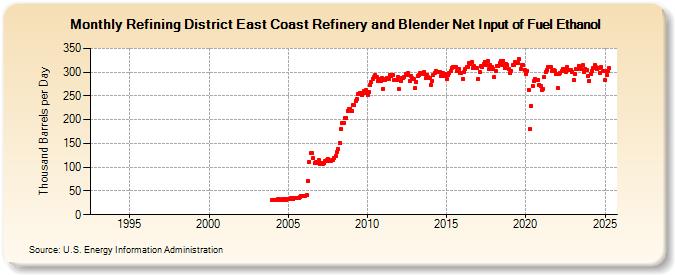
| Refining District East Coast Refinery and Blender Net Input of Fuel Ethanol (Thousand Barrels per Day) | ||||||||
| Year | Jan | Feb | Mar | Apr | May | Jun | Jul | Aug | Sep | Oct | Nov | Dec |
|---|---|---|---|---|---|---|---|---|---|---|---|---|
| 1993 | W | W | W | W | W | W | W | W | W | W | W | W |
| 1994 | W | W | W | W | W | W | W | W | W | W | W | W |
| 1995 | W | W | W | W | W | W | W | W | W | W | W | W |
| 1996 | W | W | W | W | W | W | W | |||||
| 1997 | W | W | W | W | W | W | W | W | W | W | ||
| 1998 | W | W | W | W | ||||||||
| 1999 | W | W | W | W | W | W | W | |||||
| 2000 | W | W | W | W | W | W | W | |||||
| 2001 | W | W | W | W | W | W | W | |||||
| 2002 | W | W | W | W | W | W | W | W | W | W | W | |
| 2003 | W | W | W | W | W | W | W | W | W | W | W | W |
| 2004 | 30 | 30 | 32 | 32 | 33 | 33 | 32 | 32 | 33 | 33 | 32 | 34 |
| 2005 | 33 | 34 | 35 | 35 | 33 | 36 | 35 | 35 | 36 | 37 | 39 | 40 |
| 2006 | 39 | 40 | 42 | 71 | 111 | 129 | 129 | 119 | 109 | 110 | 108 | 115 |
| 2007 | 106 | 109 | 107 | 108 | 112 | 115 | 117 | 114 | 114 | 115 | 115 | 120 |
| 2008 | 124 | 133 | 138 | 151 | 180 | 194 | 194 | 203 | 204 | 219 | 222 | 223 |
| 2009 | 218 | 231 | 230 | 240 | 244 | 253 | 256 | 256 | 251 | 260 | 257 | 262 |
| 2010 | 252 | 258 | 272 | 280 | 286 | 289 | 293 | 289 | 282 | 286 | 282 | 287 |
| 2011 | 265 | 283 | 286 | 288 | 286 | 293 | 291 | 293 | 284 | 284 | 283 | 290 |
| 2012 | 264 | 281 | 288 | 287 | 290 | 296 | 295 | 298 | 282 | 291 | 287 | 285 |
| 2013 | 266 | 279 | 292 | 294 | 298 | 299 | 296 | 300 | 287 | 295 | 289 | 287 |
| 2014 | 274 | 281 | 293 | 299 | 303 | 301 | 300 | 301 | 292 | 299 | 292 | 297 |
| 2015 | 285 | 293 | 298 | 303 | 309 | 310 | 311 | 311 | 302 | 307 | 299 | 298 |
| 2016 | 285 | 300 | 306 | 310 | 311 | 320 | 317 | 321 | 309 | 312 | 308 | 308 |
| 2017 | 286 | 300 | 312 | 310 | 318 | 322 | 316 | 323 | 306 | 315 | 311 | 307 |
| 2018 | 289 | 302 | 313 | 312 | 319 | 323 | 316 | 324 | 308 | 318 | 315 | 307 |
| 2019 | 298 | 302 | 315 | 316 | 322 | 319 | 320 | 327 | 307 | 316 | 314 | 305 |
| 2020 | 297 | 303 | 263 | 180 | 229 | 271 | 281 | 286 | 283 | 284 | 273 | 270 |
| 2021 | 262 | 265 | 290 | 300 | 305 | 310 | 310 | 310 | 303 | 305 | 303 | 296 |
| 2022 | 267 | 296 | 299 | 302 | 307 | 307 | 301 | 310 | 304 | 304 | 305 | 301 |
| 2023 | 282 | 298 | 306 | 306 | 313 | 310 | 307 | 314 | 301 | 307 | 304 | 291 |
| 2024 | 282 | 297 | 303 | 309 | ||||||||
| - = No Data Reported; -- = Not Applicable; NA = Not Available; W = Withheld to avoid disclosure of individual company data. |
| Release Date: 6/28/2024 |
| Next Release Date: 7/31/2024 |