|
Download Data (XLS File) |
|
||||||||
|
||||||||
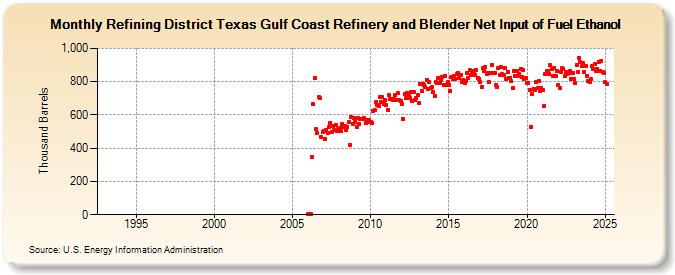
| Refining District Texas Gulf Coast Refinery and Blender Net Input of Fuel Ethanol (Thousand Barrels) | ||||||||
| Year | Jan | Feb | Mar | Apr | May | Jun | Jul | Aug | Sep | Oct | Nov | Dec |
|---|---|---|---|---|---|---|---|---|---|---|---|---|
| 1993 | W | W | W | W | W | W | W | W | W | W | W | W |
| 1994 | W | W | W | W | W | W | W | W | W | W | W | W |
| 1995 | W | W | W | W | W | W | W | W | W | W | W | W |
| 1996 | W | W | W | W | W | W | W | W | W | W | W | W |
| 1997 | W | W | W | W | W | W | W | W | W | W | W | W |
| 1998 | W | W | W | W | W | W | W | W | W | W | W | W |
| 1999 | W | W | W | W | W | W | W | W | W | W | W | W |
| 2000 | W | W | W | W | W | W | W | W | W | W | W | W |
| 2001 | W | W | W | W | W | W | W | W | W | W | W | W |
| 2002 | W | W | W | W | W | W | W | W | W | W | W | W |
| 2003 | W | W | W | W | W | W | W | W | W | W | W | W |
| 2006 | 2 | 3 | 3 | 349 | 664 | 822 | 514 | 492 | 707 | 700 | 466 | 497 |
| 2007 | 505 | 454 | 509 | 494 | 525 | 553 | 495 | 535 | 507 | 539 | 505 | 516 |
| 2008 | 519 | 506 | 545 | 528 | 533 | 512 | 526 | 555 | 421 | 588 | 547 | 580 |
| 2009 | 556 | 530 | 580 | 544 | 573 | 573 | 577 | 580 | 550 | 570 | 558 | 570 |
| 2010 | 556 | 554 | 626 | 629 | 676 | 661 | 656 | 708 | 677 | 707 | 666 | 689 |
| 2011 | 657 | 630 | 718 | 696 | 696 | 692 | 693 | 720 | 692 | 730 | 689 | 686 |
| 2012 | 665 | 578 | 724 | 699 | 731 | 713 | 701 | 739 | 682 | 736 | 689 | 700 |
| 2013 | 717 | 673 | 786 | 745 | 788 | 777 | 766 | 808 | 756 | 797 | 763 | 765 |
| 2014 | 739 | 716 | 799 | 792 | 822 | 793 | 809 | 829 | 781 | 837 | 780 | 799 |
| 2015 | 778 | 743 | 830 | 813 | 831 | 815 | 845 | 852 | 819 | 840 | 797 | 811 |
| 2016 | 791 | 806 | 855 | 822 | 870 | 843 | 865 | 861 | 840 | 869 | 819 | 817 |
| 2017 | 798 | 765 | 880 | 862 | 890 | 845 | 855 | 797 | 853 | 903 | 852 | 852 |
| 2018 | 777 | 765 | 882 | 838 | 887 | 844 | 839 | 882 | 814 | 859 | 820 | 824 |
| 2019 | 801 | 761 | 863 | 836 | 867 | 833 | 849 | 877 | 825 | 872 | 814 | 819 |
| 2020 | 794 | 792 | 750 | 528 | 726 | 758 | 747 | 796 | 759 | 805 | 743 | 760 |
| 2021 | 751 | 655 | 848 | 864 | 864 | 845 | 898 | 877 | 836 | 884 | 833 | 862 |
| 2022 | 780 | 761 | 860 | 880 | 876 | 831 | 861 | 848 | 855 | 864 | 813 | 851 |
| 2023 | 804 | 793 | 916 | 852 | 931 | 933 | 892 | 896 | 878 | 885 | 830 | 814 |
| 2024 | 795 | |||||||||||
| - = No Data Reported; -- = Not Applicable; NA = Not Available; W = Withheld to avoid disclosure of individual company data. |
| Release Date: 3/29/2024 |
| Next Release Date: 4/30/2024 |