|
Download Data (XLS File) |
|
||||||||
|
||||||||
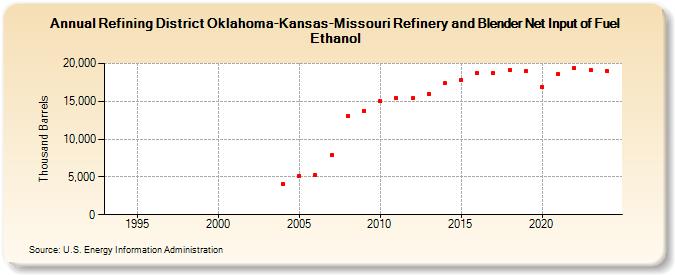
| Refining District Oklahoma-Kansas-Missouri Refinery and Blender Net Input of Fuel Ethanol (Thousand Barrels) | ||||||||
| Decade | Year-0 | Year-1 | Year-2 | Year-3 | Year-4 | Year-5 | Year-6 | Year-7 | Year-8 | Year-9 |
|---|---|---|---|---|---|---|---|---|---|---|
| 1990's | W | W | W | W | W | W | W | |||
| 2000's | W | W | W | W | 4,001 | 5,139 | 5,226 | 7,909 | 13,082 | 13,777 |
| 2010's | 15,054 | 15,420 | 15,372 | 16,028 | 17,373 | 17,765 | 18,699 | 18,687 | 19,150 | 18,962 |
| 2020's | 16,949 | 18,640 | 19,343 | 19,165 |
| - = No Data Reported; -- = Not Applicable; NA = Not Available; W = Withheld to avoid disclosure of individual company data. |
| Release Date: 3/29/2024 |
| Next Release Date: 8/30/2024 |