|
Download Data (XLS File) |
|
||||||||
|
||||||||
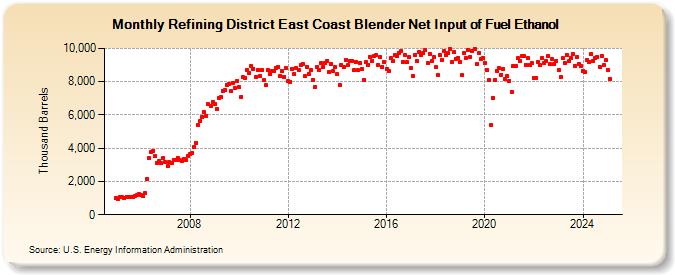
| Refining District East Coast Blender Net Input of Fuel Ethanol (Thousand Barrels) | ||||||||
| Year | Jan | Feb | Mar | Apr | May | Jun | Jul | Aug | Sep | Oct | Nov | Dec |
|---|---|---|---|---|---|---|---|---|---|---|---|---|
| 2005 | 1,018 | 941 | 1,082 | 1,039 | 1,031 | 1,078 | 1,093 | 1,090 | 1,066 | 1,144 | 1,157 | 1,241 |
| 2006 | 1,203 | 1,111 | 1,292 | 2,133 | 3,417 | 3,768 | 3,839 | 3,547 | 3,129 | 3,254 | 3,094 | 3,409 |
| 2007 | 3,148 | 2,907 | 3,156 | 3,083 | 3,299 | 3,261 | 3,426 | 3,313 | 3,244 | 3,364 | 3,281 | 3,531 |
| 2008 | 3,674 | 3,697 | 4,091 | 4,329 | 5,398 | 5,647 | 5,879 | 6,152 | 5,961 | 6,629 | 6,519 | 6,781 |
| 2009 | 6,635 | 6,360 | 7,009 | 7,086 | 7,455 | 7,481 | 7,814 | 7,837 | 7,433 | 7,941 | 7,615 | 8,038 |
| 2010 | 7,668 | 7,083 | 8,266 | 8,236 | 8,713 | 8,521 | 8,928 | 8,781 | 8,300 | 8,690 | 8,315 | 8,727 |
| 2011 | 8,076 | 7,772 | 8,690 | 8,454 | 8,669 | 8,616 | 8,844 | 8,895 | 8,343 | 8,629 | 8,302 | 8,806 |
| 2012 | 8,030 | 7,980 | 8,769 | 8,453 | 8,811 | 8,704 | 8,991 | 9,083 | 8,310 | 8,881 | 8,471 | 8,698 |
| 2013 | 8,117 | 7,685 | 8,891 | 8,698 | 9,117 | 8,904 | 9,134 | 9,259 | 8,572 | 9,089 | 8,631 | 8,853 |
| 2014 | 8,434 | 7,806 | 9,005 | 8,888 | 9,320 | 8,973 | 9,234 | 9,257 | 8,677 | 9,200 | 8,684 | 9,125 |
| 2015 | 8,770 | 8,121 | 9,152 | 9,024 | 9,499 | 9,230 | 9,562 | 9,577 | 8,989 | 9,457 | 8,906 | 9,156 |
| 2016 | 8,766 | 8,628 | 9,405 | 9,213 | 9,576 | 9,521 | 9,739 | 9,858 | 9,208 | 9,604 | 9,179 | 9,463 |
| 2017 | 8,818 | 8,348 | 9,616 | 9,229 | 9,793 | 9,610 | 9,714 | 9,933 | 9,117 | 9,681 | 9,254 | 9,456 |
| 2018 | 8,881 | 8,388 | 9,626 | 9,291 | 9,818 | 9,609 | 9,715 | 9,967 | 9,167 | 9,777 | 9,385 | 9,443 |
| 2019 | 9,168 | 8,396 | 9,717 | 9,428 | 9,920 | 9,507 | 9,844 | 9,982 | 9,062 | 9,716 | 9,346 | 9,393 |
| 2020 | 9,149 | 8,729 | 8,095 | 5,374 | 7,040 | 8,087 | 8,656 | 8,810 | 8,430 | 8,764 | 8,139 | 8,334 |
| 2021 | 8,062 | 7,385 | 8,938 | 8,920 | 9,395 | 9,220 | 9,530 | 9,549 | 9,021 | 9,398 | 9,026 | 9,094 |
| 2022 | 8,215 | 8,236 | 9,206 | 8,982 | 9,444 | 9,125 | 9,249 | 9,531 | 9,043 | 9,339 | 9,087 | 9,252 |
| 2023 | 8,686 | 8,271 | 9,405 | 9,120 | 9,632 | 9,220 | 9,447 | 9,656 | 8,966 | 9,456 | 9,057 | 8,946 |
| 2024 | 8,670 | |||||||||||
| - = No Data Reported; -- = Not Applicable; NA = Not Available; W = Withheld to avoid disclosure of individual company data. |
| Release Date: 3/29/2024 |
| Next Release Date: 4/30/2024 |
Referring Pages: