|
Download Data (XLS File) |
|
||||||||
|
||||||||
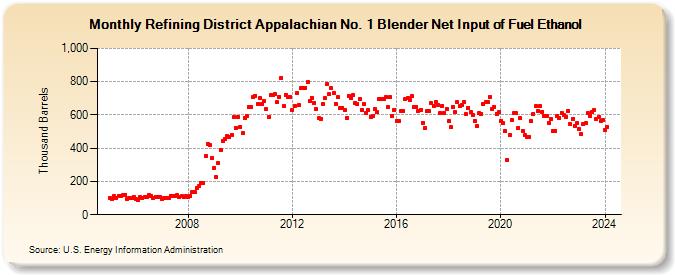
| Refining District Appalachian No. 1 Blender Net Input of Fuel Ethanol (Thousand Barrels) | ||||||||
| Year | Jan | Feb | Mar | Apr | May | Jun | Jul | Aug | Sep | Oct | Nov | Dec |
|---|---|---|---|---|---|---|---|---|---|---|---|---|
| 2005 | 101 | 97 | 110 | 103 | 112 | 113 | 117 | 121 | 97 | 103 | 103 | 108 |
| 2006 | 92 | 91 | 106 | 100 | 105 | 107 | 118 | 113 | 101 | 108 | 105 | 108 |
| 2007 | 94 | 98 | 102 | 102 | 115 | 110 | 112 | 117 | 107 | 110 | 104 | 110 |
| 2008 | 106 | 112 | 138 | 138 | 162 | 170 | 193 | 193 | 352 | 425 | 418 | 342 |
| 2009 | 281 | 224 | 311 | 388 | 444 | 453 | 472 | 467 | 481 | 588 | 523 | 588 |
| 2010 | 528 | 489 | 584 | 592 | 648 | 649 | 705 | 716 | 666 | 699 | 664 | 681 |
| 2011 | 633 | 585 | 717 | 719 | 724 | 676 | 710 | 822 | 651 | 722 | 706 | 709 |
| 2012 | 631 | 653 | 729 | 657 | 763 | 759 | 764 | 797 | 686 | 703 | 674 | 636 |
| 2013 | 579 | 578 | 667 | 701 | 786 | 723 | 760 | 733 | 668 | 705 | 640 | 643 |
| 2014 | 629 | 579 | 714 | 701 | 717 | 670 | 665 | 695 | 630 | 666 | 613 | 629 |
| 2015 | 589 | 591 | 637 | 615 | 697 | 693 | 696 | 706 | 649 | 707 | 593 | 630 |
| 2016 | 564 | 563 | 624 | 624 | 697 | 701 | 692 | 712 | 648 | 650 | 624 | 630 |
| 2017 | 553 | 524 | 624 | 622 | 669 | 652 | 679 | 662 | 609 | 656 | 613 | 638 |
| 2018 | 561 | 525 | 649 | 616 | 675 | 651 | 662 | 678 | 603 | 644 | 615 | 597 |
| 2019 | 565 | 533 | 609 | 608 | 663 | 676 | 678 | 709 | 636 | 649 | 608 | 616 |
| 2020 | 566 | 549 | 502 | 329 | 479 | 571 | 611 | 610 | 524 | 580 | 505 | 477 |
| 2021 | 465 | 470 | 566 | 606 | 653 | 625 | 652 | 620 | 594 | 596 | 554 | 575 |
| 2022 | 506 | 505 | 595 | 580 | 612 | 600 | 587 | 625 | 545 | 577 | 536 | 550 |
| 2023 | 514 | 486 | 543 | 549 | 611 | 596 | 618 | 629 | 578 | 587 | 564 | 569 |
| 2024 | 511 | |||||||||||
| - = No Data Reported; -- = Not Applicable; NA = Not Available; W = Withheld to avoid disclosure of individual company data. |
| Release Date: 3/29/2024 |
| Next Release Date: 4/30/2024 |
Referring Pages: