|
Download Data (XLS File) |
|
||||||||
|
||||||||
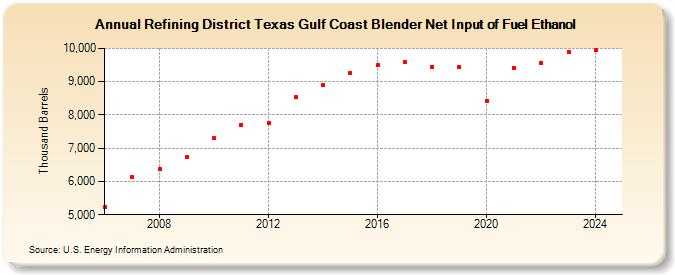
| Refining District Texas Gulf Coast Blender Net Input of Fuel Ethanol (Thousand Barrels) | ||||||||
| Decade | Year-0 | Year-1 | Year-2 | Year-3 | Year-4 | Year-5 | Year-6 | Year-7 | Year-8 | Year-9 |
|---|---|---|---|---|---|---|---|---|---|---|
| 2000's | 5,219 | 6,137 | 6,360 | 6,739 | ||||||
| 2010's | 7,304 | 7,712 | 7,756 | 8,551 | 8,902 | 9,255 | 9,501 | 9,577 | 9,451 | 9,437 |
| 2020's | 8,430 | 9,423 | 9,549 | 9,902 |
| - = No Data Reported; -- = Not Applicable; NA = Not Available; W = Withheld to avoid disclosure of individual company data. |
| Release Date: 3/29/2024 |
| Next Release Date: 8/30/2024 |
Referring Pages: