|
Download Data (XLS File) |
|
||||||||
|
||||||||
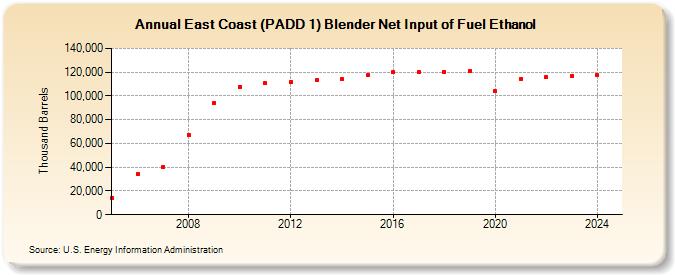
| East Coast (PADD 1) Blender Net Input of Fuel Ethanol (Thousand Barrels) | ||||||||
| Decade | Year-0 | Year-1 | Year-2 | Year-3 | Year-4 | Year-5 | Year-6 | Year-7 | Year-8 | Year-9 |
|---|---|---|---|---|---|---|---|---|---|---|
| 2000's | 14,265 | 34,450 | 40,294 | 67,506 | 93,924 | |||||
| 2010's | 107,849 | 110,470 | 111,633 | 113,133 | 114,511 | 117,246 | 119,889 | 120,070 | 120,543 | 121,029 |
| 2020's | 103,910 | 114,514 | 115,527 | 116,706 |
| - = No Data Reported; -- = Not Applicable; NA = Not Available; W = Withheld to avoid disclosure of individual company data. |
| Release Date: 6/28/2024 |
| Next Release Date: 8/30/2024 |
Referring Pages: