|
Download Data (XLS File) |
|
||||||||
|
||||||||
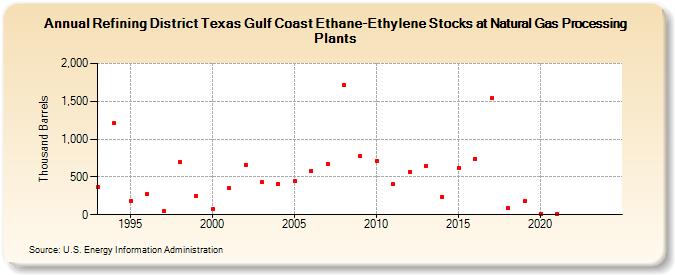
| Refining District Texas Gulf Coast Ethane-Ethylene Stocks at Natural Gas Processing Plants (Thousand Barrels) | ||||||||
| Decade | Year-0 | Year-1 | Year-2 | Year-3 | Year-4 | Year-5 | Year-6 | Year-7 | Year-8 | Year-9 |
|---|---|---|---|---|---|---|---|---|---|---|
| 1990's | 363 | 1,215 | 184 | 277 | 49 | 697 | 253 | |||
| 2000's | 78 | 347 | 662 | 433 | 411 | 442 | 582 | 673 | 1,717 | 773 |
| 2010's | 714 | 401 | 566 | 647 | 237 | 622 | 741 | 1,539 | 87 | 183 |
| 2020's | 13 | 14 | -- | -- |
| - = No Data Reported; -- = Not Applicable; NA = Not Available; W = Withheld to avoid disclosure of individual company data. |
| Release Date: 3/29/2024 |
| Next Release Date: 8/30/2024 |